Click here to see the SAS code.
Click here to see the example.
This example is a proof-of-concept, and uses a small subset
of data from an archaeological excavation in Allendale SC.
The data was in Microsoft Access database, and I used SAS/Access
(proc import) to read the data directly into a sas dataset.
I designed the program so that you can easily specify the min & max
'northing' and 'easting' coordinates of the excavated units you
want to see in the plot. This would make it easy to automate
so that it can be run for all the data.
Each type/category of artifact is given a different shape & color.
I'm annotating the markers to gain complete control over the
size/shape/color -- but, since I'm annotating them, I also have to
annotate the legend (which I do on the 2nd page, using proc ganno).
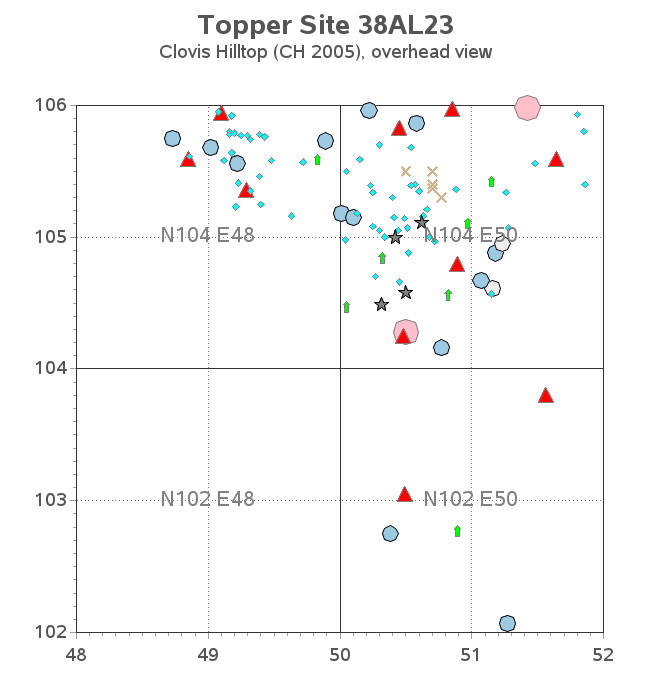
I annotate dark lines at each 2-meter increment (because this is
how they excavate the units), and I annotate the name of the 2x2 unit
in the center of each.
Each artifact has html mouse-over text with the details, and you can
click the marker to jump to its line in the data table (via html anchor).
In the table, you can click the catalogue number (blue) to see an image
of that artifact (since I don't have images of all these artifacts, I just
have it show a generic image right now).
----------------------------------------------------------
Below is a walk-through, with screen-captures:
----------------------------------------------------------
In the main/first graph, each category of artifact is shown
using a different marker shape & color.
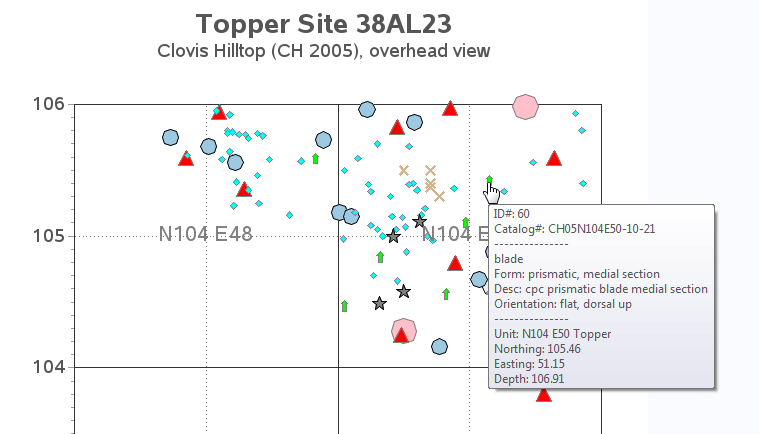
 In the main graph, you can hover your mouse over the markers
to see details about what that artifact is. Here's a screen-capture,
for example.
In the main graph, you can hover your mouse over the markers
to see details about what that artifact is. Here's a screen-capture,
for example.
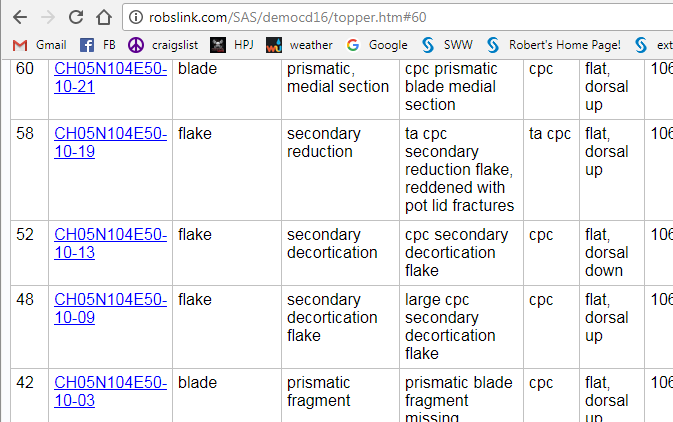
 If you click a marker in the graph, your web browser will jump
down to that artifact.s line in the table (that table is farther
down on the same page, and you jump there via a html 'anchor').
For example, if I click on the green 'blade' marker shown with the
mouse-over text above, it jumps to the CH05N104E50-10-21 line in the
table, as shown in the screen-capture below. Once you're in the table,
you can click the blue .catalogue number. to see a photo of the artifact -
of course, I don't actually have photos of all these artifacts, therefore
I'm just using the same generic photo for each of them right now.
When you're viewing an image, it brings the image up in a 2nd browser
window - that way you can look at the table info and the image at the
same time. Right now I've got it drilling-down to an image, but you could
also have it drill-down to a web page that contains more info & multiple
images, etc. (You can click the web browser.s .back. button to go back from
the table to the graph again.)
If you click a marker in the graph, your web browser will jump
down to that artifact.s line in the table (that table is farther
down on the same page, and you jump there via a html 'anchor').
For example, if I click on the green 'blade' marker shown with the
mouse-over text above, it jumps to the CH05N104E50-10-21 line in the
table, as shown in the screen-capture below. Once you're in the table,
you can click the blue .catalogue number. to see a photo of the artifact -
of course, I don't actually have photos of all these artifacts, therefore
I'm just using the same generic photo for each of them right now.
When you're viewing an image, it brings the image up in a 2nd browser
window - that way you can look at the table info and the image at the
same time. Right now I've got it drilling-down to an image, but you could
also have it drill-down to a web page that contains more info & multiple
images, etc. (You can click the web browser.s .back. button to go back from
the table to the graph again.)
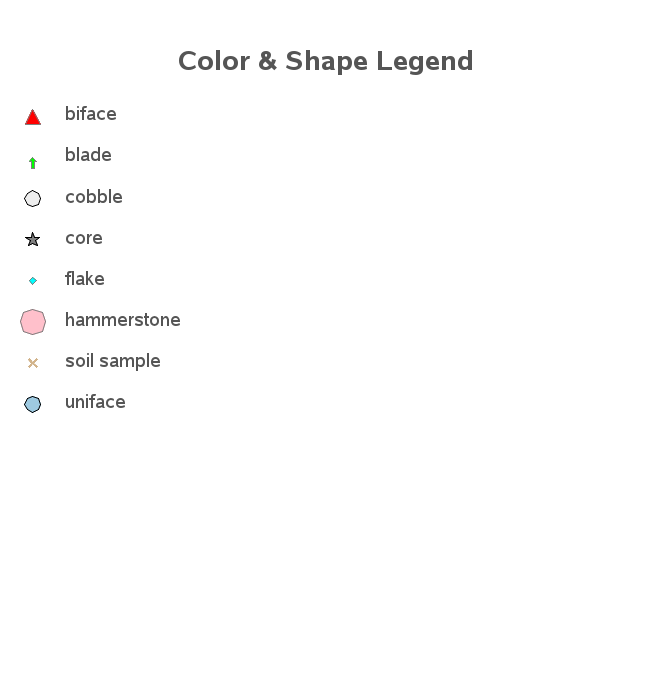
 There is a key for the shapes & colors on the 2nd page (scroll down
below the graph).
There is a key for the shapes & colors on the 2nd page (scroll down
below the graph).
 Back to Samples Index