Robert Allison's SAS/Graph Samples #24
Click on thumbnail to see full-size chart.
Click on label to see descriptions and SAS code.
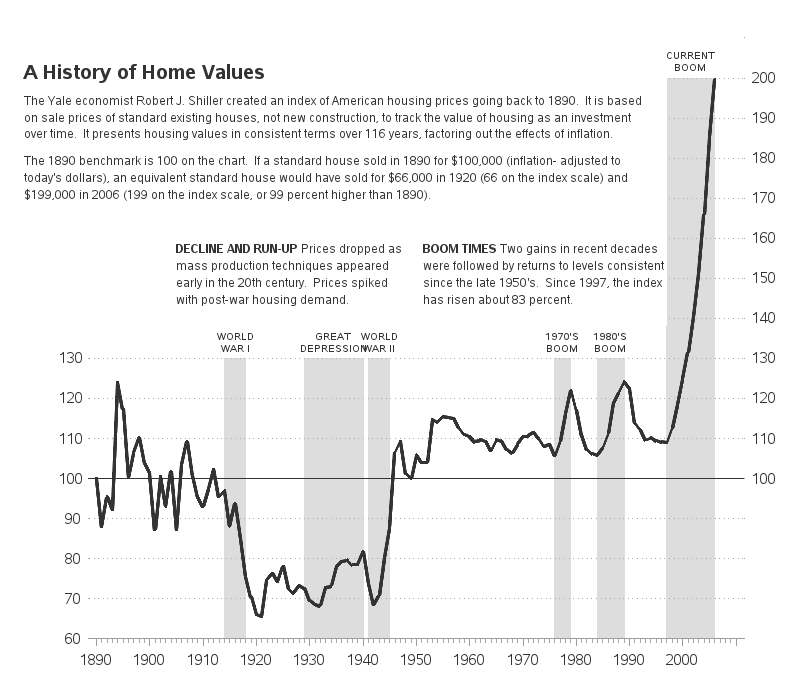
Home Values Analysis
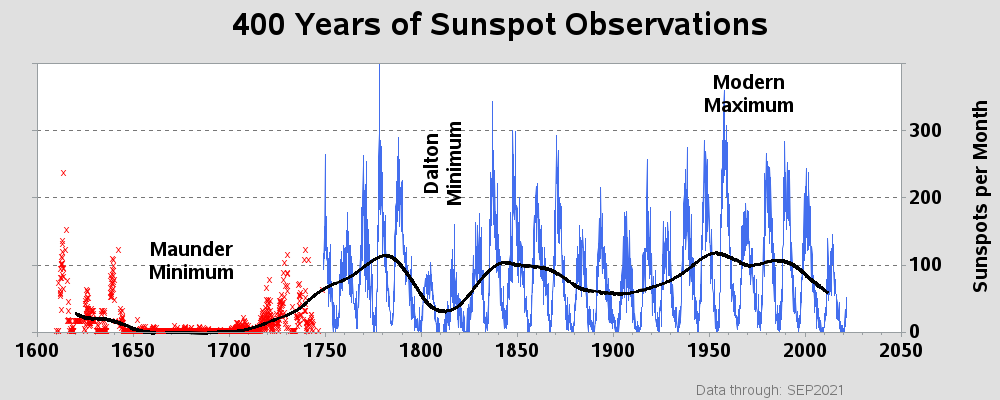
Sunspot Activity Graph
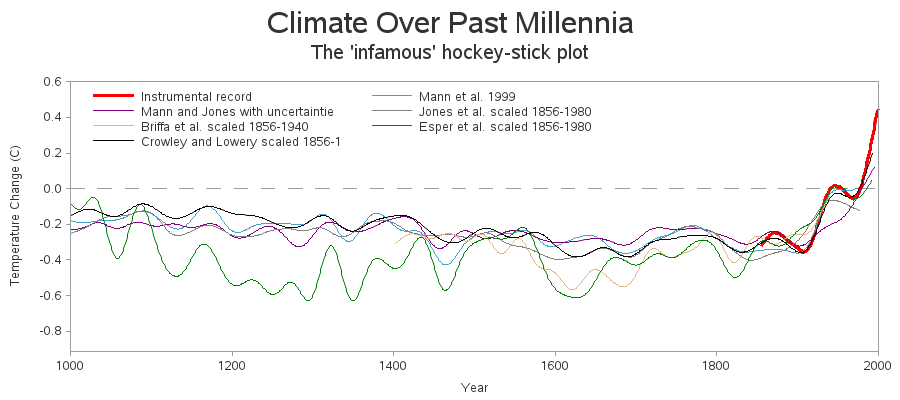
Hockey Stick Graph
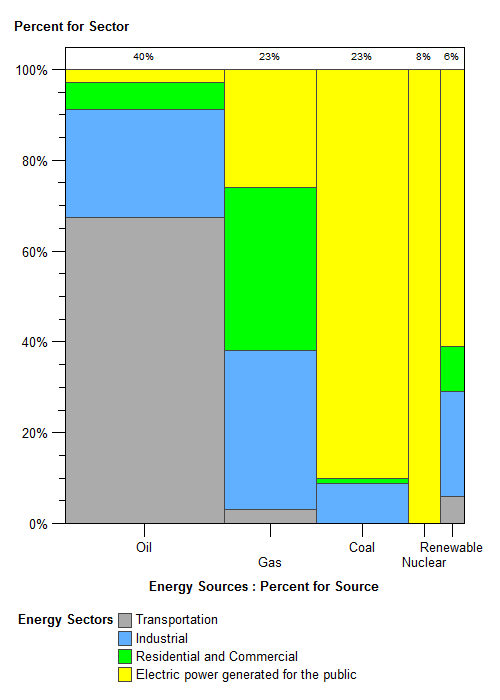
Energy Study
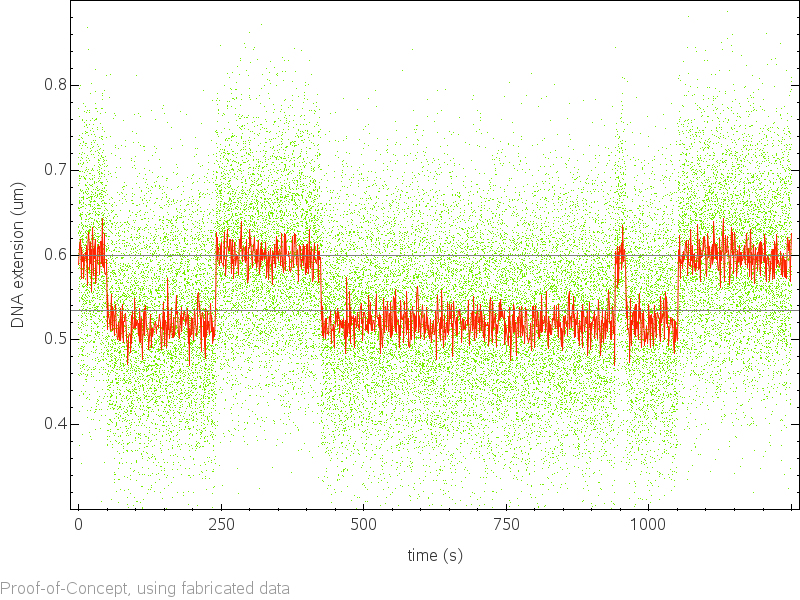
Transition-Amplitude
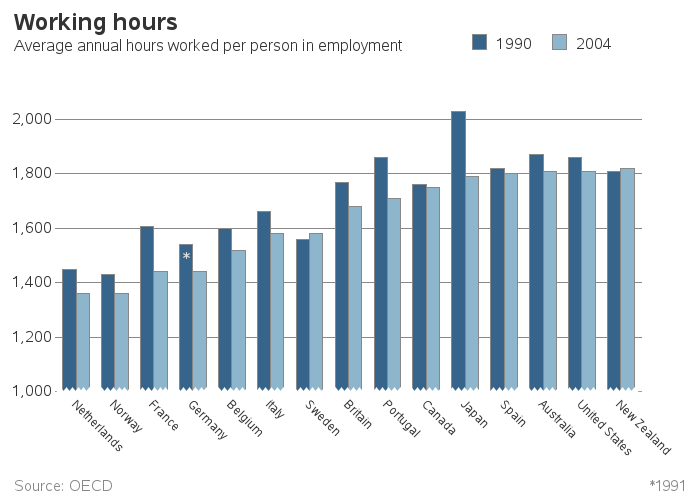
Work Hours Comparison
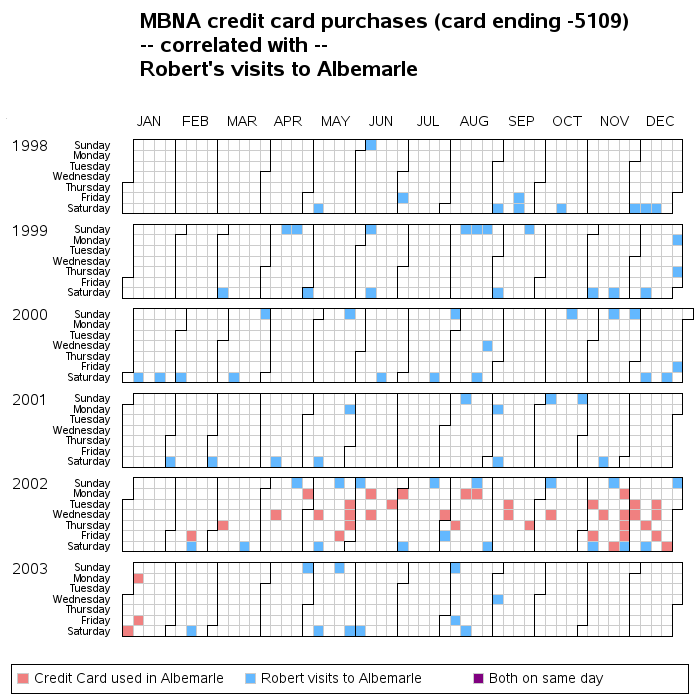
Fraud Detection
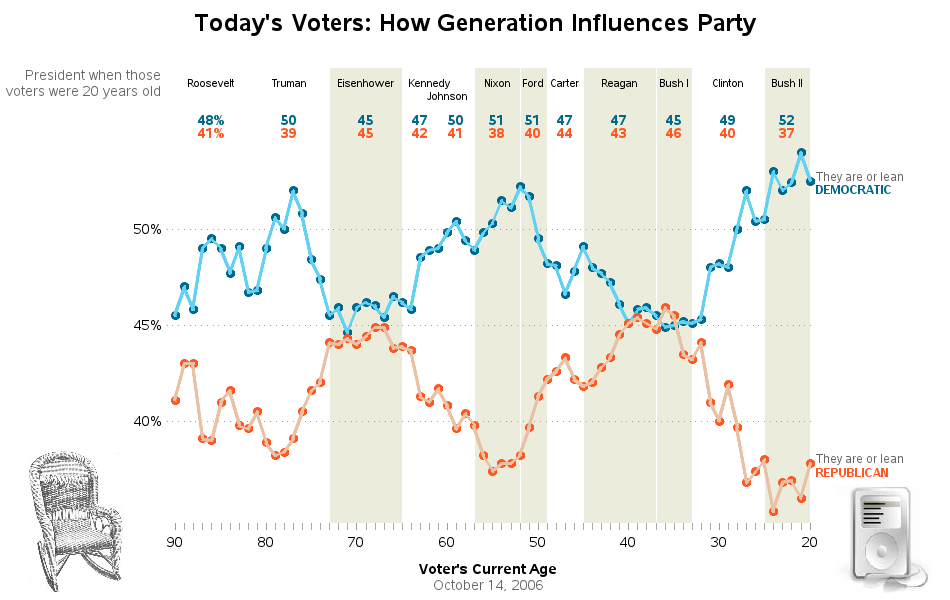
Generations of Voters
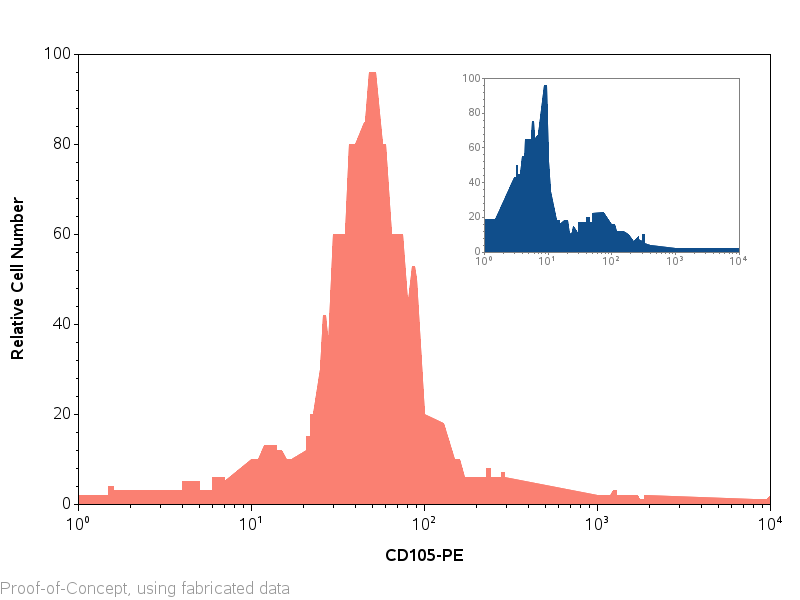
Isolating Human CD105
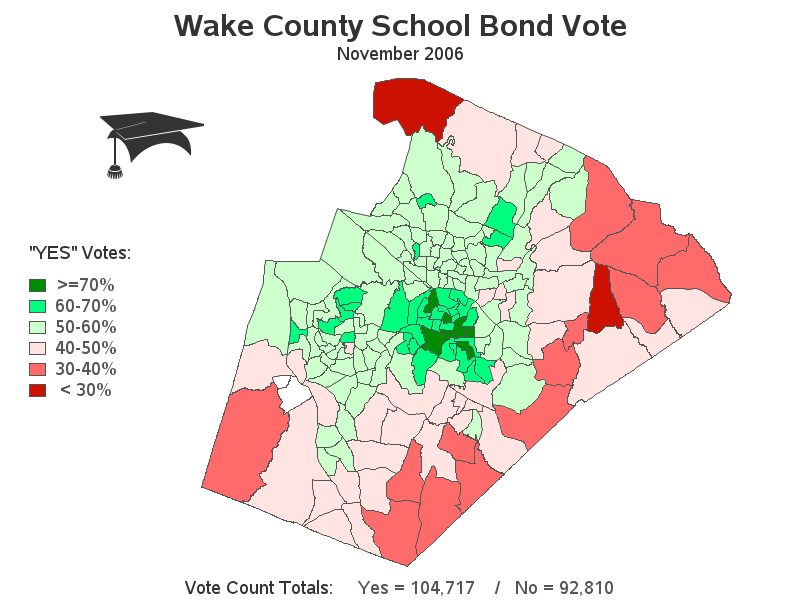
Wake School Bond Vote
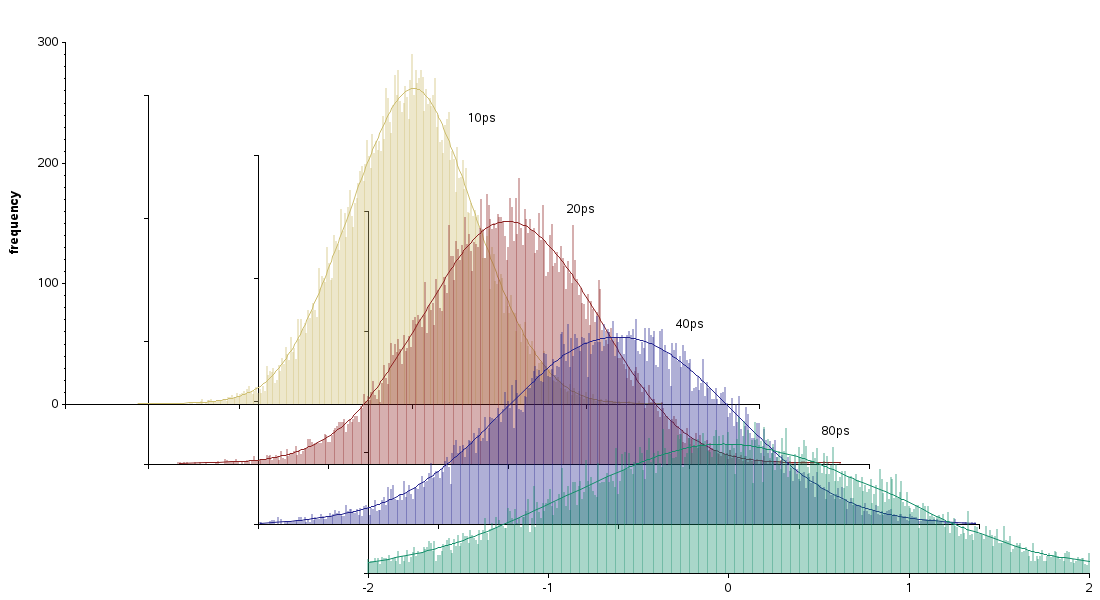
Multiple Distribution Plots
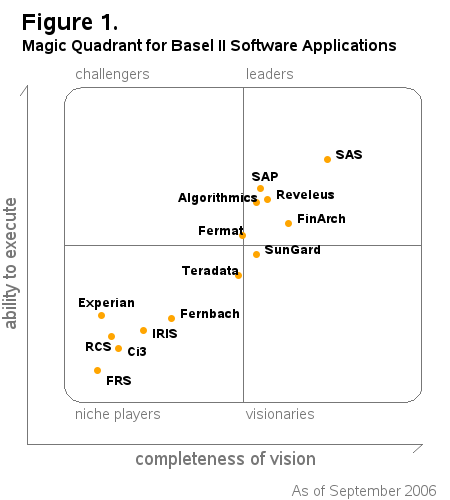
Magic Quadrant (Basel II)
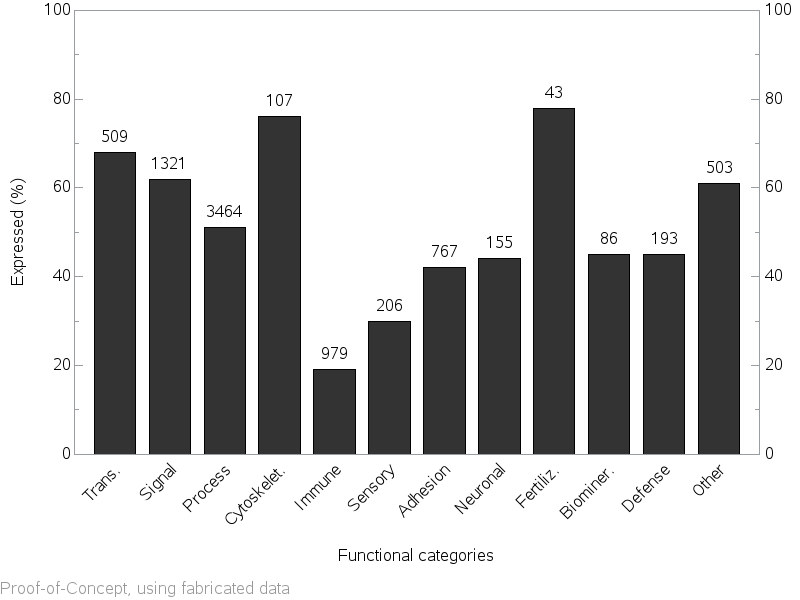
Distribution of Genes
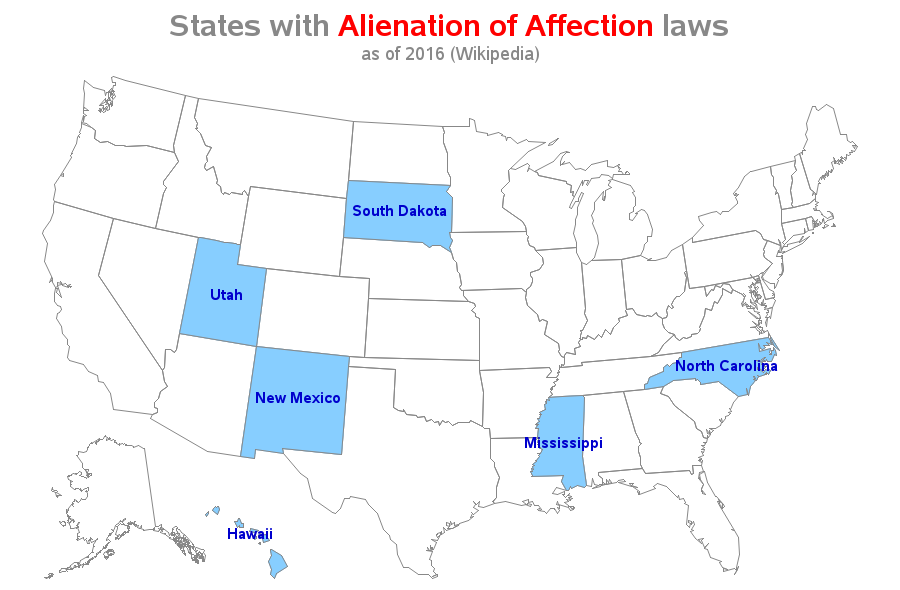
Outdated Law States
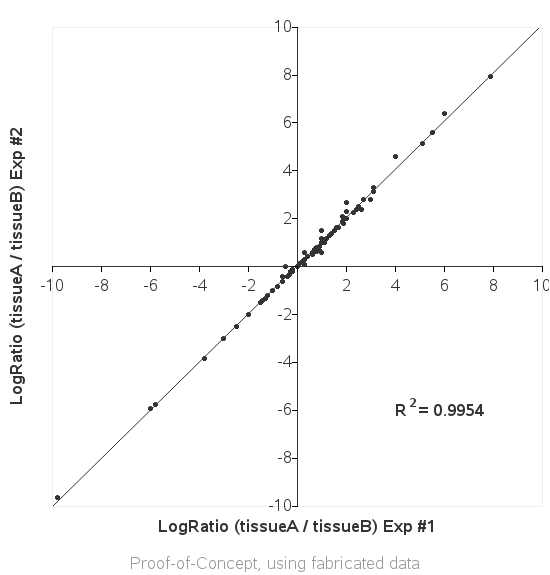
Regression Analysis
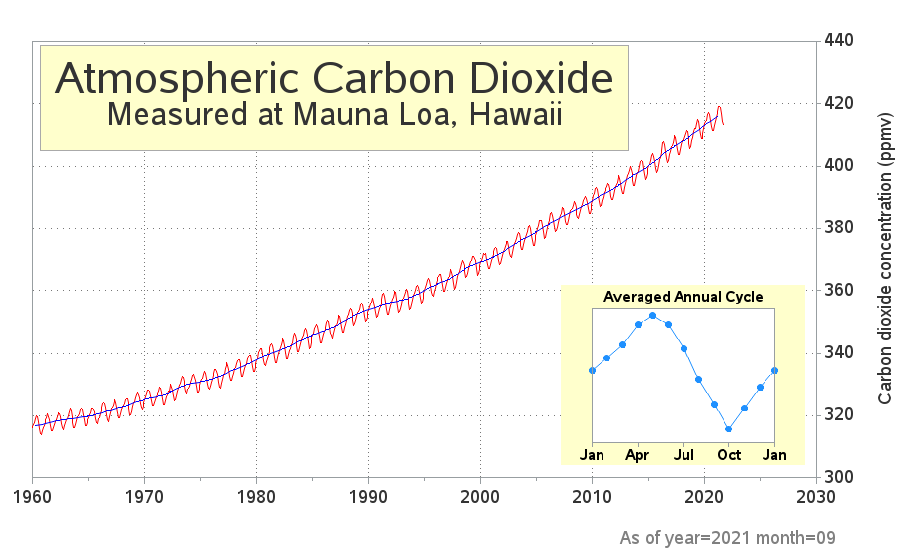
CO2 Increase Graph
Myrtle Beach Advisories and Closings

![]()
These samples courtesy of Robert Allison
Please see the following README