Click here to see the SAS code.
Click here to see the example.
---------------------------------------------------------------
A while back, the "DashboardSpy" posted up a mock-up of a dashboard
for an iPhone. He got it from BonaVista Systems (it was a graphic they had
used for a contest), and I checked with Andreas Lipphardt of BonaVista Systems
and he says the iPhone dashboard is a "screen mockup".
http://www.enterprise-dashboard.com/2008/05/05/the-future-of-excel-dashboards/
 I decided to try to create the _real_ thing, using SAS/Graph! :)
---
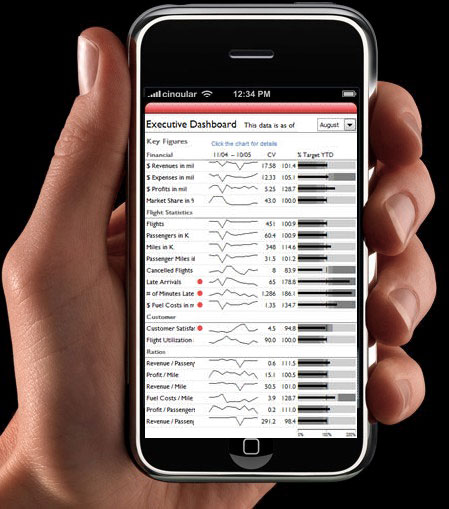
Here's a photo of my SAS/Graph dashboard being displayed on an iPhone:
I decided to try to create the _real_ thing, using SAS/Graph! :)
---
Here's a photo of my SAS/Graph dashboard being displayed on an iPhone:
 And, of course, once you save the image on the iPhone, you can do all
the nifty iPhone-y things, such as zoom & rotate ...
Getting ready to zoom:
And, of course, once you save the image on the iPhone, you can do all
the nifty iPhone-y things, such as zoom & rotate ...
Getting ready to zoom:
 Zoomed-in:
 Zoomed image, rotated, to see more of a particular line/row of the graph:
 -----
How did I create it?
First, I found that the screen dimensions of an iPhone are 320x480 pixels.
Therefore, I set my xpixels and ypixels to those values.
Then, to create the dashboard, I started with a "gplot", but I only
used it for the haxis and to give me a coordinate system to work with.
I pretty much annotated everything except for the numbers on the haxis.
The names of the "Key Figures" along the left are actually outside of
the gplot axes, and everything to the right of that text is 'inside'
of the plot axes. I used a large "offset" value in my haxis to allow
room for me to annotate the red dots, the sparklines, the CV, and
the bar values to the left of the 0% axis value. I use an angled
title on the left of the graph to guarantee that I have room on that
side to annotate the text for the "Key Figure" names.
For the sparklines, I put 12 variables in my dataset (line1-line12),
and connect them with annotate move/draw.
For the bullet graphs, I annotate a 'bar' for each of the 3 shaded
sections behind them, and I annotate a move/draw line segment (with
a wide thickness) for the 'bar'.
Notice that some of the lines of data have all-missing numerical values.
These are the ones for the section labels, etc.
I tried to write it somewhat generalized, so that you can have a different
number of lines of data, etc.
Back to Samples Index
-----
How did I create it?
First, I found that the screen dimensions of an iPhone are 320x480 pixels.
Therefore, I set my xpixels and ypixels to those values.
Then, to create the dashboard, I started with a "gplot", but I only
used it for the haxis and to give me a coordinate system to work with.
I pretty much annotated everything except for the numbers on the haxis.
The names of the "Key Figures" along the left are actually outside of
the gplot axes, and everything to the right of that text is 'inside'
of the plot axes. I used a large "offset" value in my haxis to allow
room for me to annotate the red dots, the sparklines, the CV, and
the bar values to the left of the 0% axis value. I use an angled
title on the left of the graph to guarantee that I have room on that
side to annotate the text for the "Key Figure" names.
For the sparklines, I put 12 variables in my dataset (line1-line12),
and connect them with annotate move/draw.
For the bullet graphs, I annotate a 'bar' for each of the 3 shaded
sections behind them, and I annotate a move/draw line segment (with
a wide thickness) for the 'bar'.
Notice that some of the lines of data have all-missing numerical values.
These are the ones for the section labels, etc.
I tried to write it somewhat generalized, so that you can have a different
number of lines of data, etc.
Back to Samples Index