Robert Allison's SAS/Graph Examples #4
Click on thumbnail to see full-size chart.
Click on label to see descriptions and SAS code.
Gradient Shaded Plot
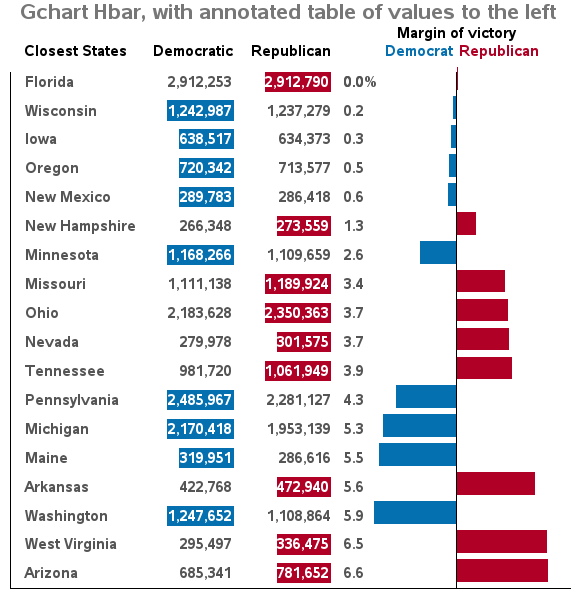
Graphics and Table
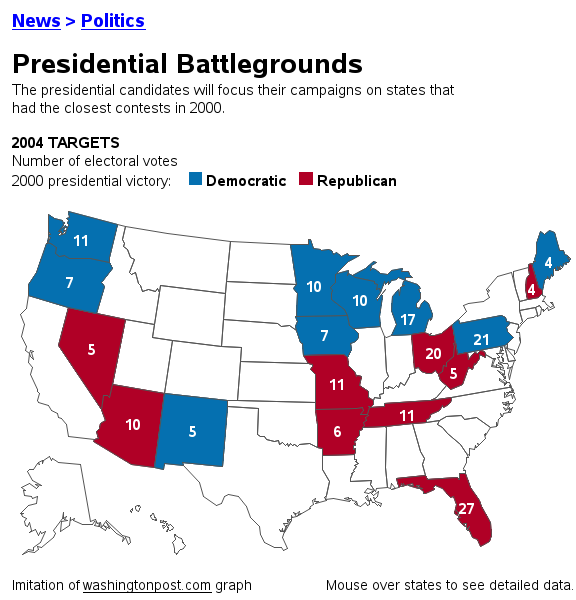
Presidential Battles
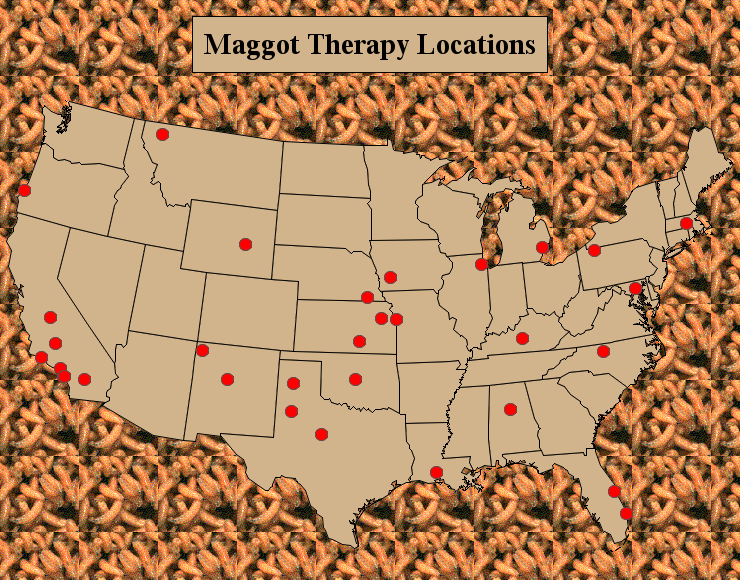
Maggot Therapy Map
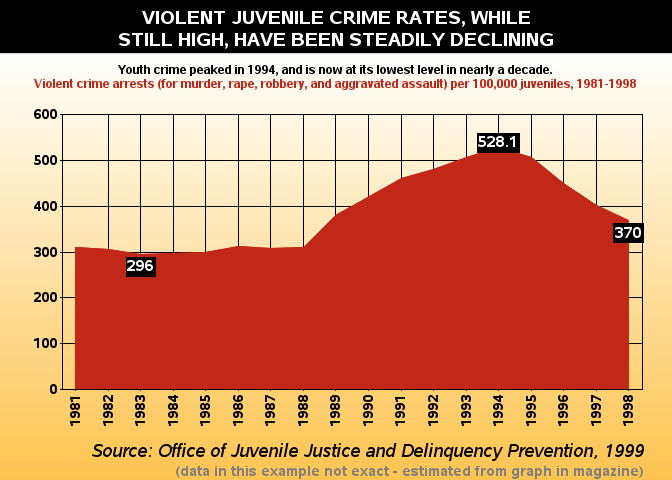
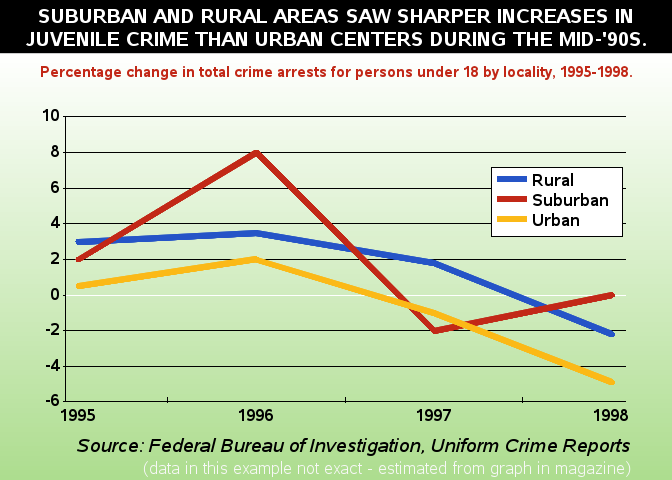
Juvenile Crime Rate
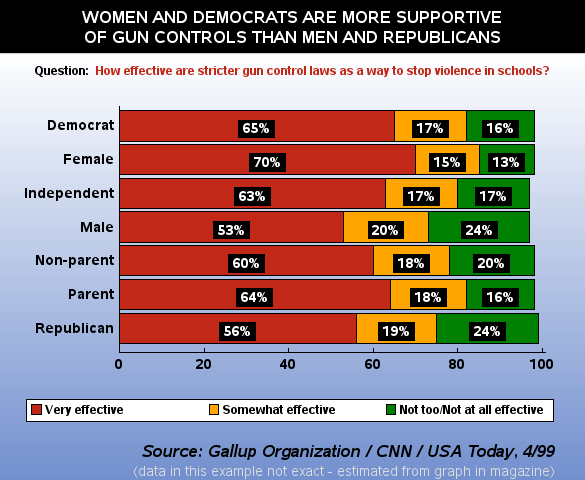
School Gun Violence
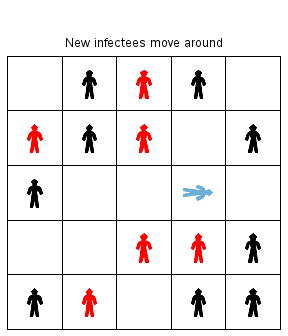
Epidemic Simulation
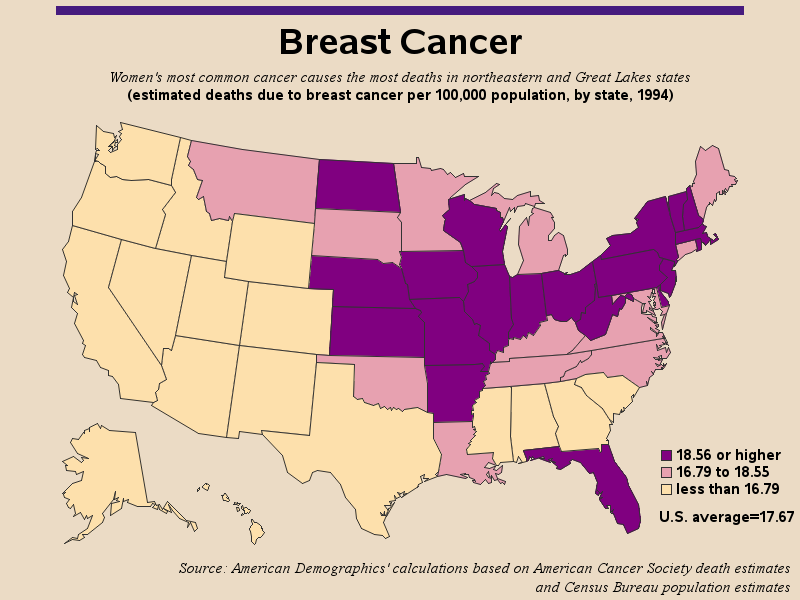
Cancer Rate Map
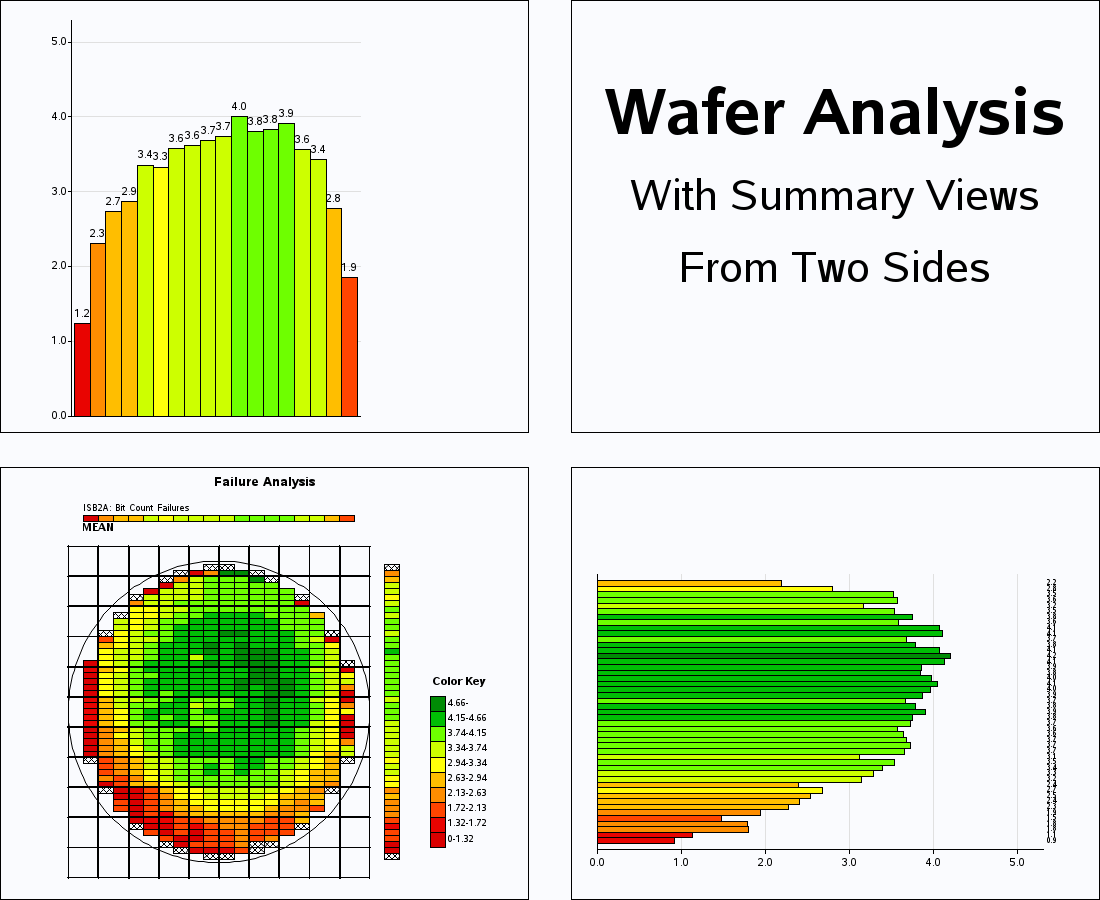

Silicon Wafer Map Analysis
Target Your Customers
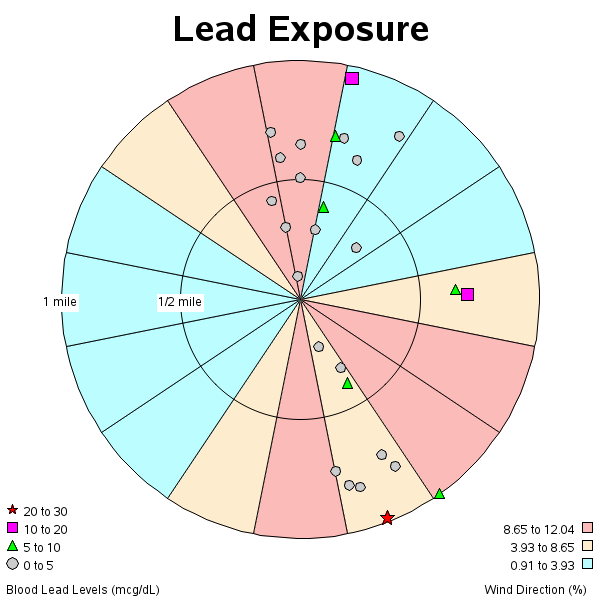
Lead Exposure Graph
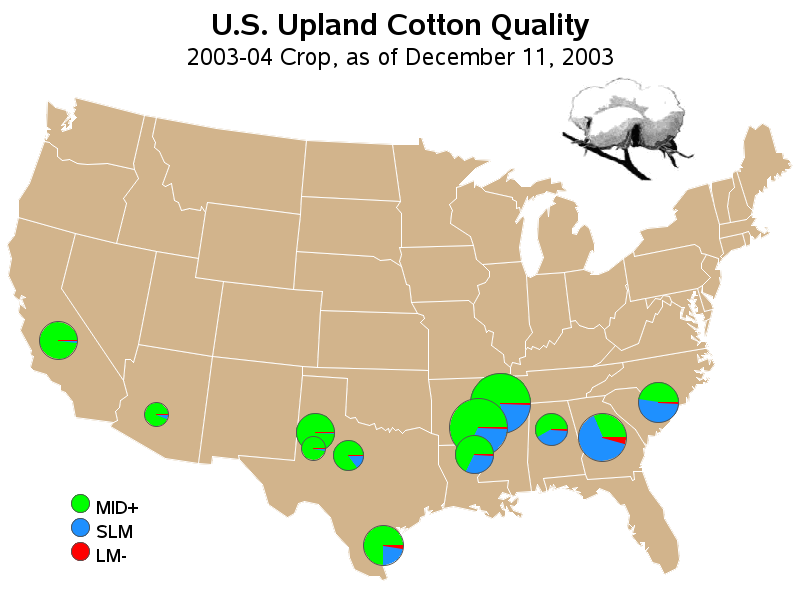
Upland Cotton Quality
![]()
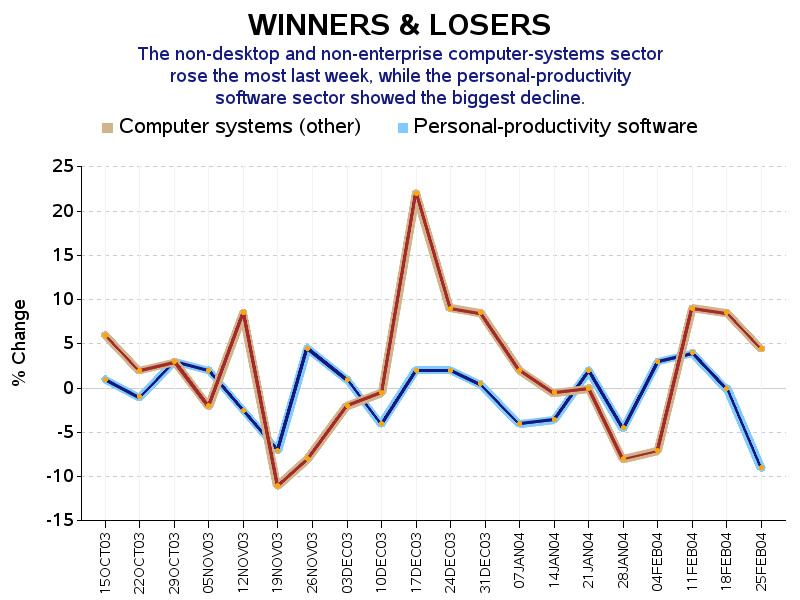
Stock - Winners and Losers
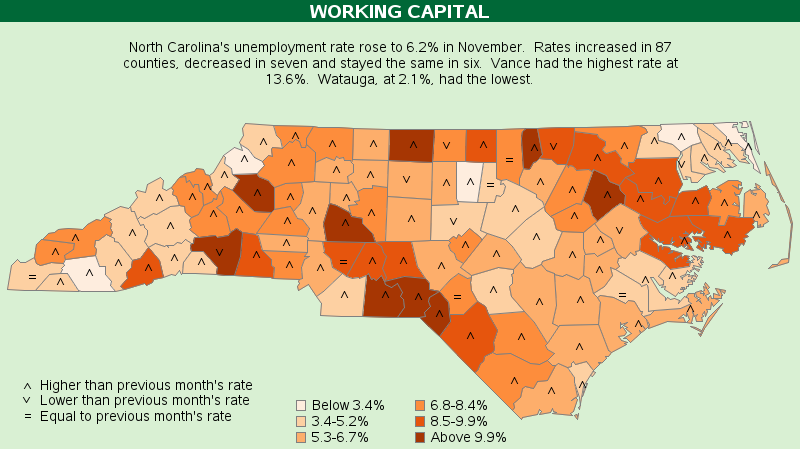
Up/Down Arrows Map
Nuclear Plant Locations
Shadow & Gradient
These samples courtesy of Robert Allison
Please see the following README