Robert Allison's SAS/Graph Samples #58
Click on thumbnail to see full-size chart.
Click on label to see descriptions and SAS code.
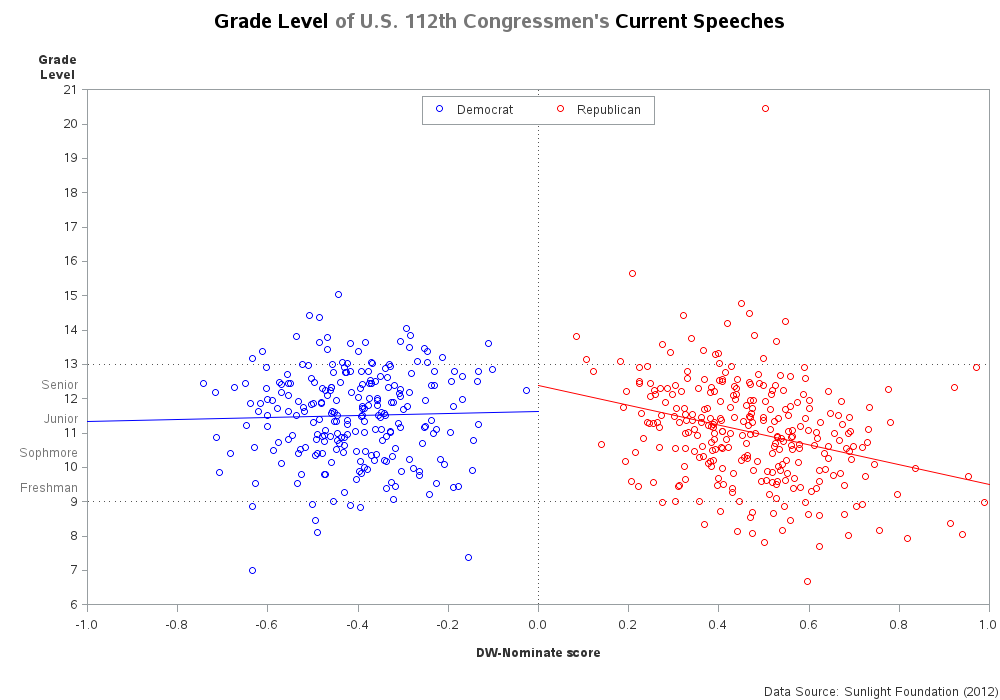
Congress Grade Level
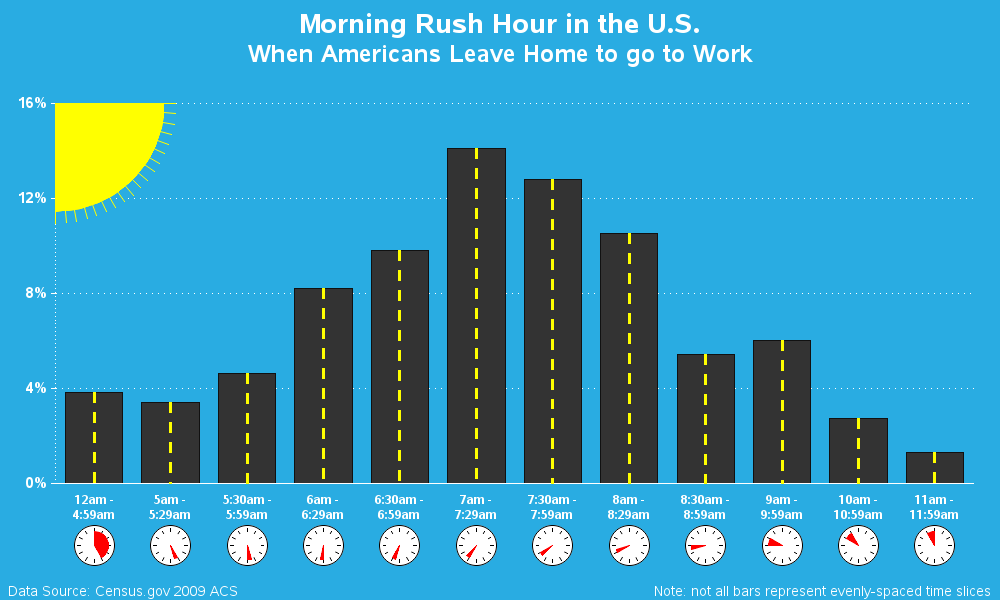
Rush Hour in US
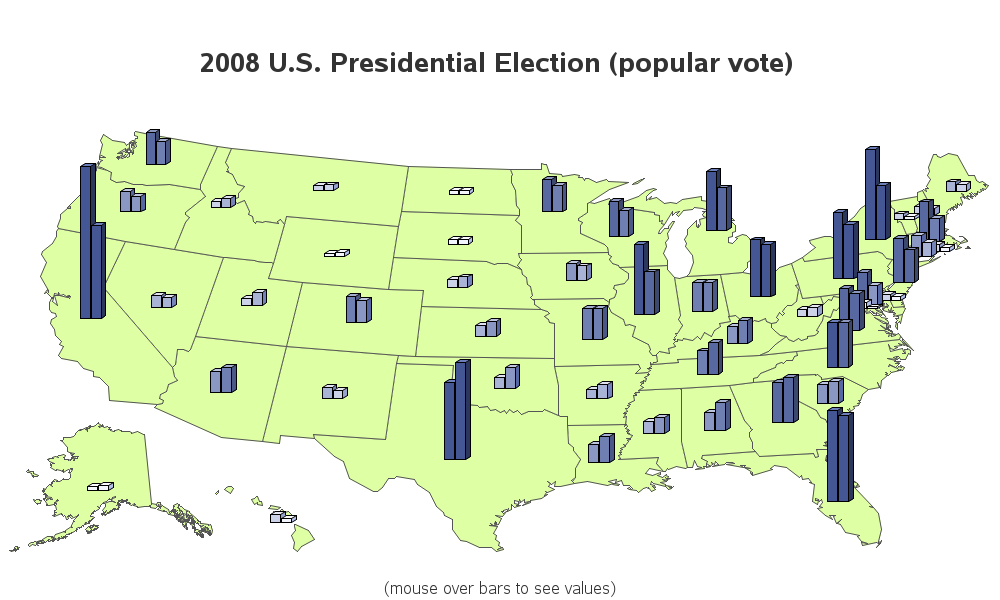
Proc Gmap w/ 2 Bars
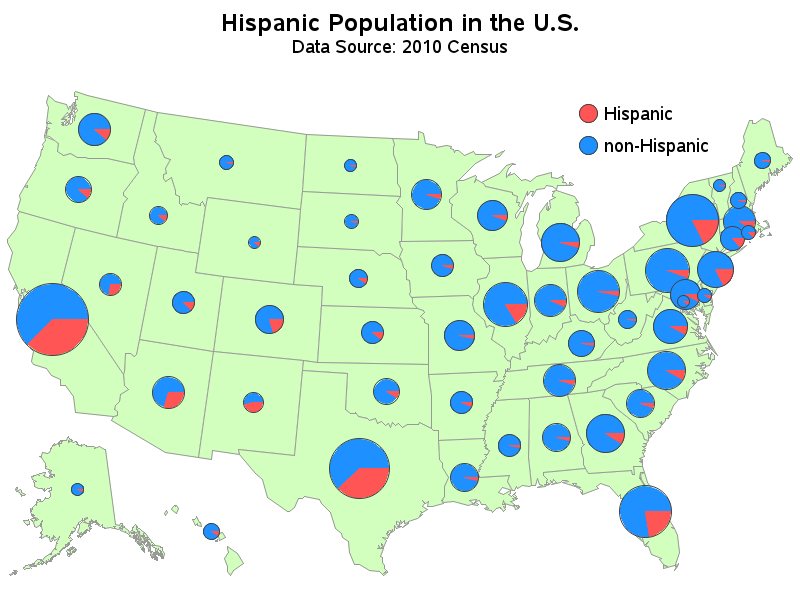
Map w/ Pie Charts
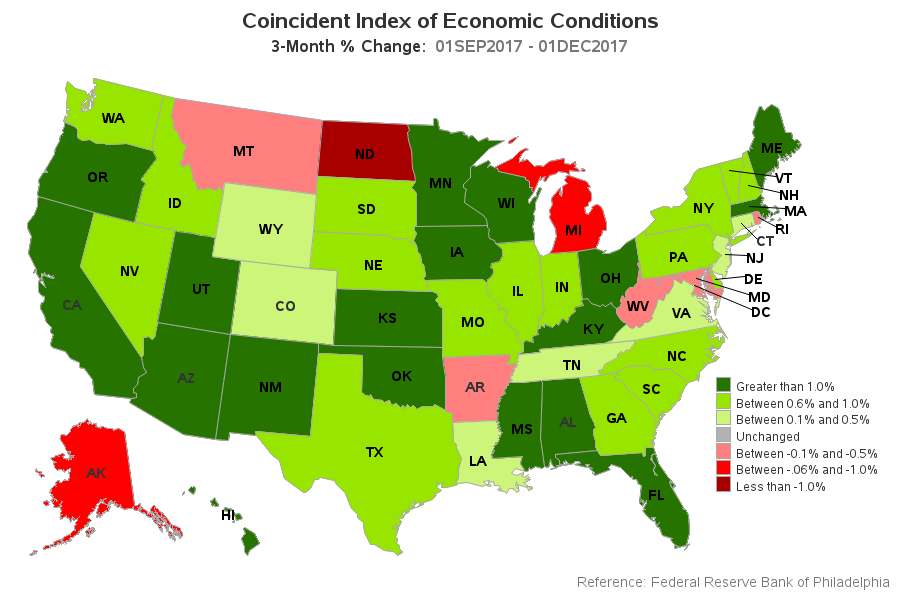
Economic Index Level
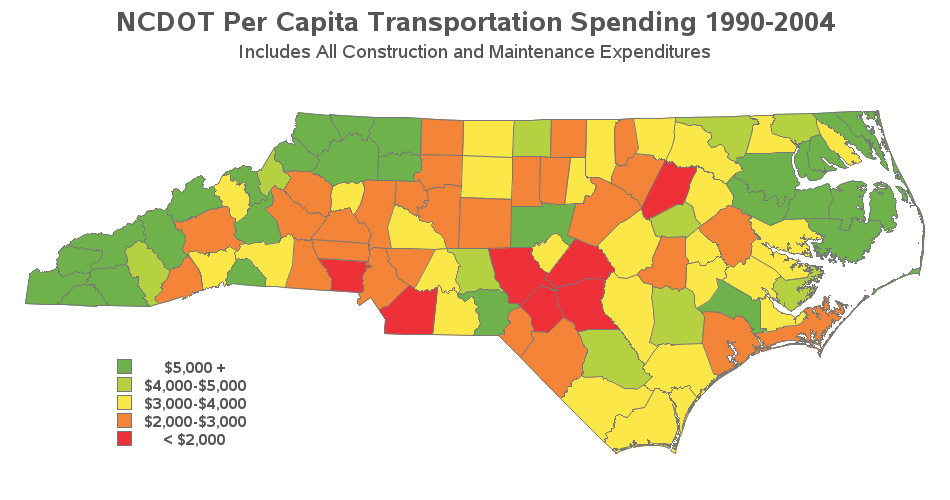
NC DOT Spending
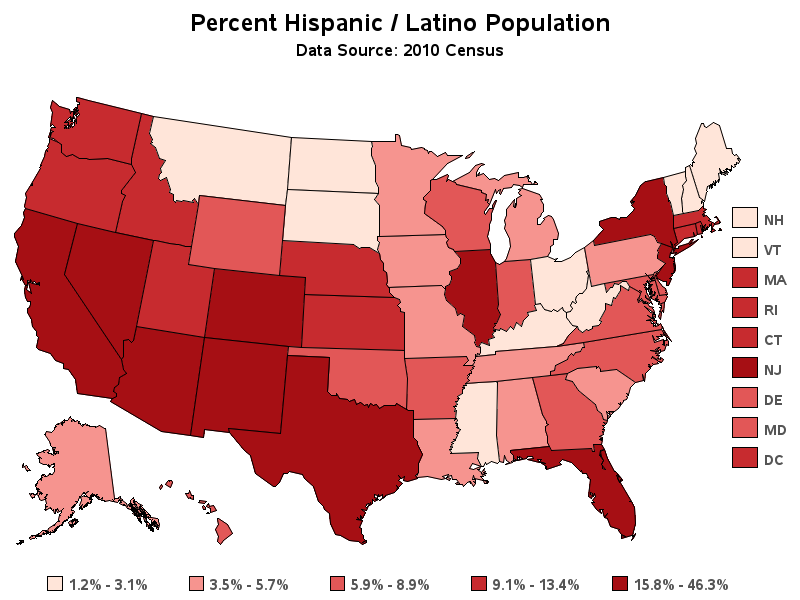
Hispanic / Latino %
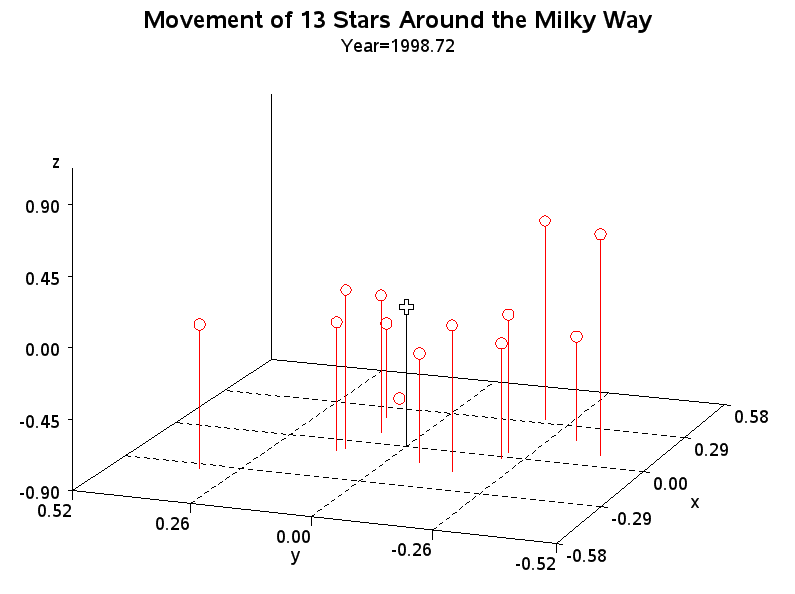
Animate Milkyway
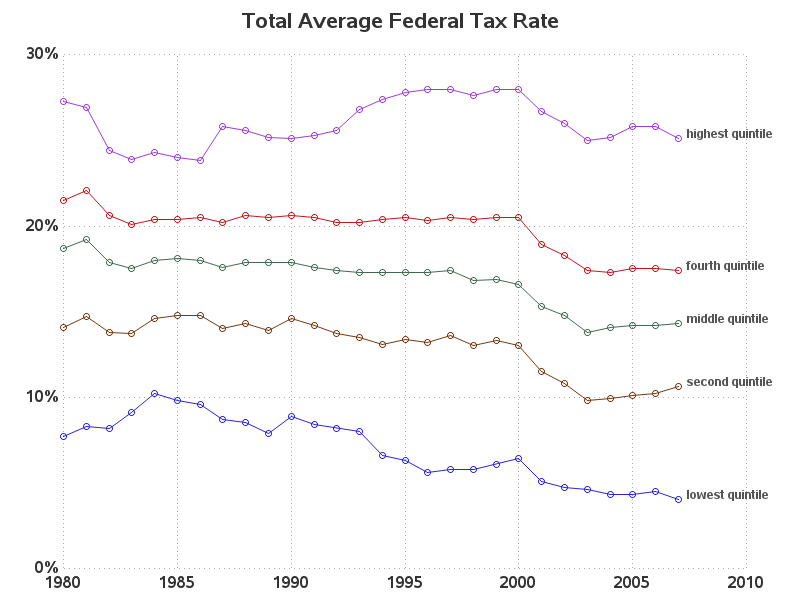
US Federal Tax Rate
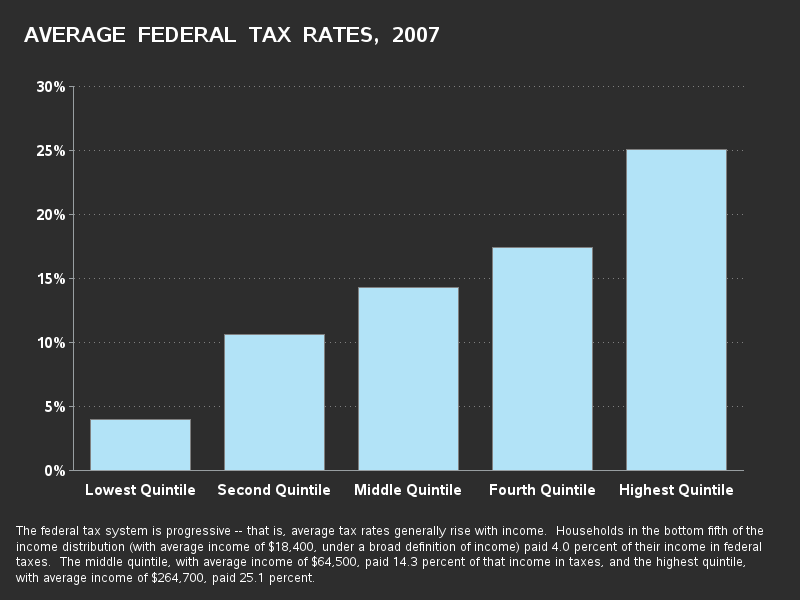
Avg Fed Tax Rate 2007
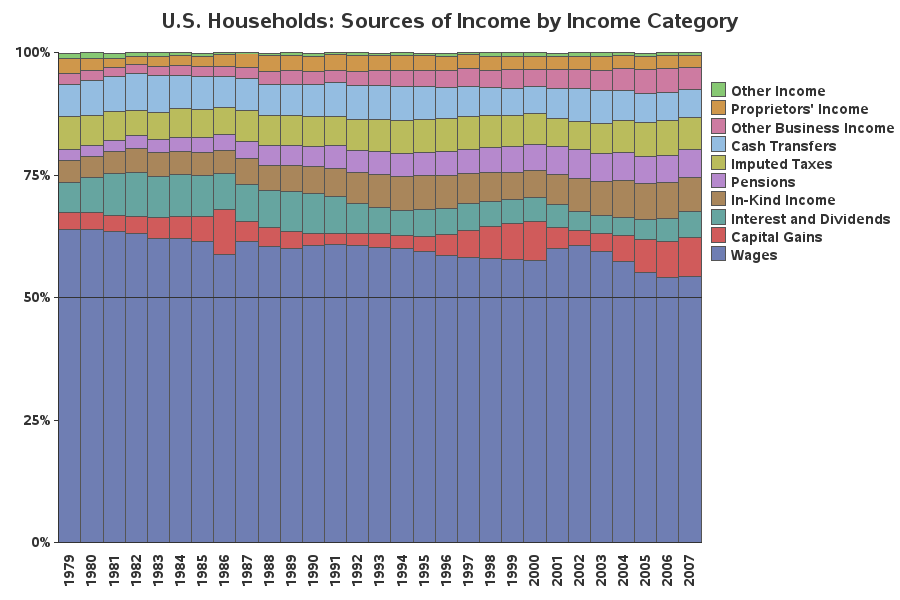
US Income Sources
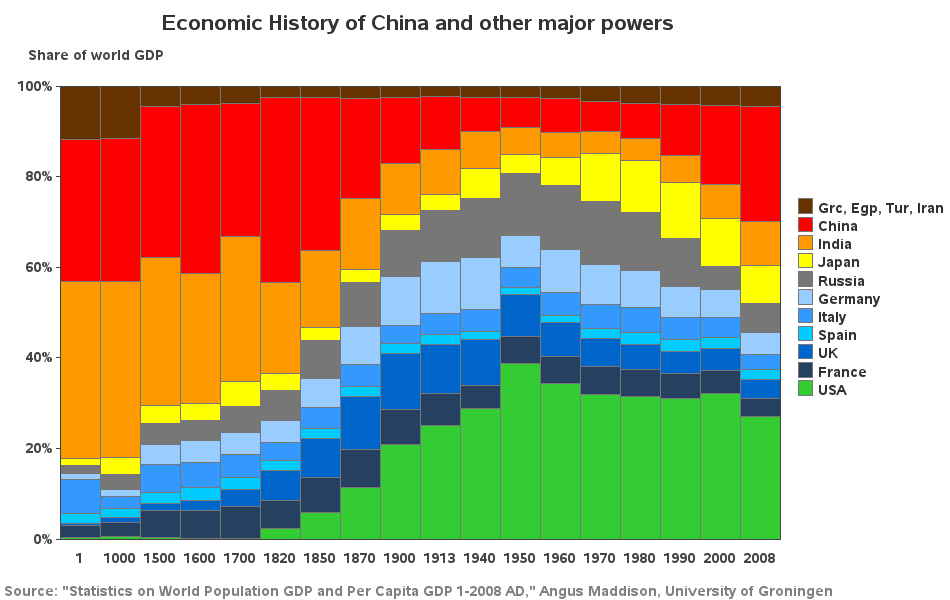
World GDP
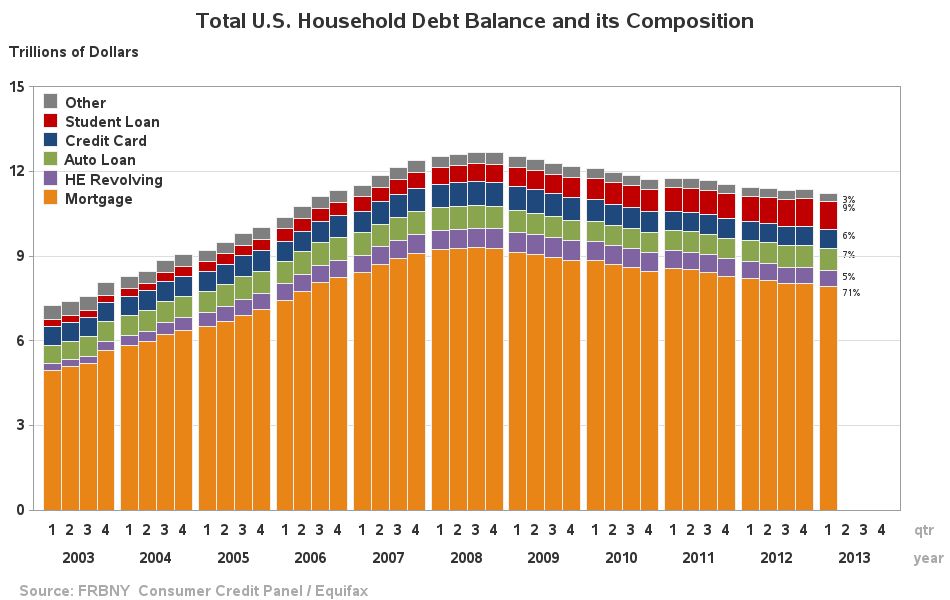
U.S. Household Debt
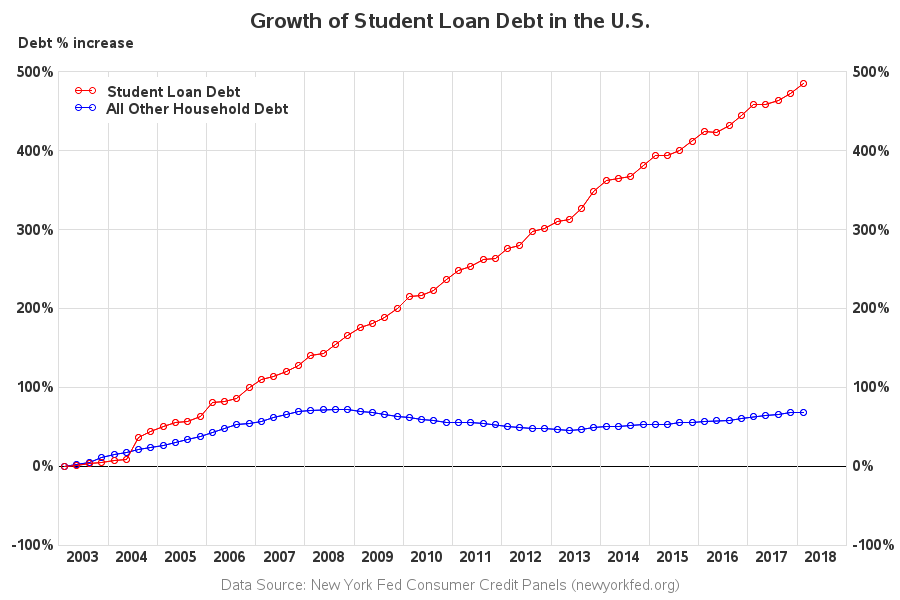
Student Loan Increase
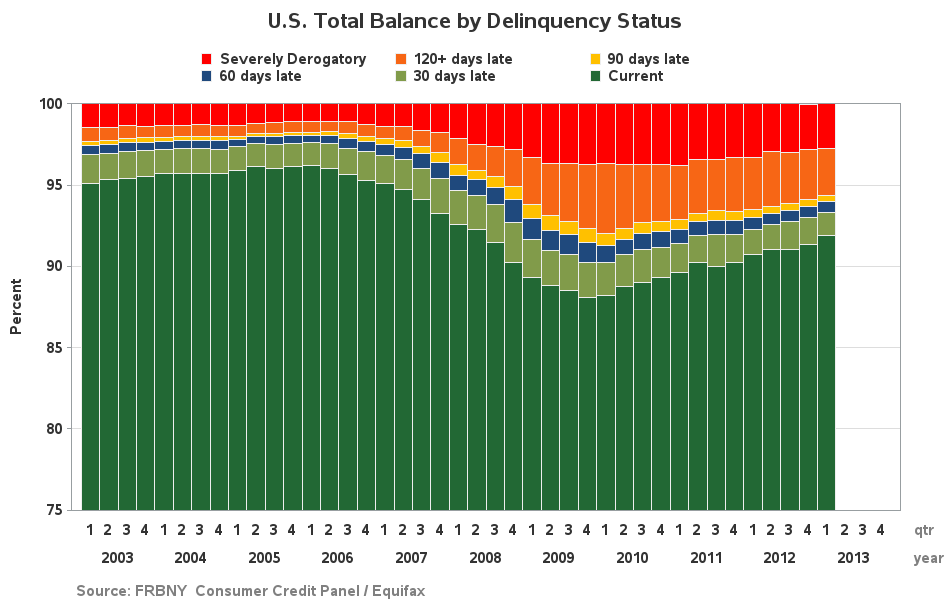
Delinquency Status
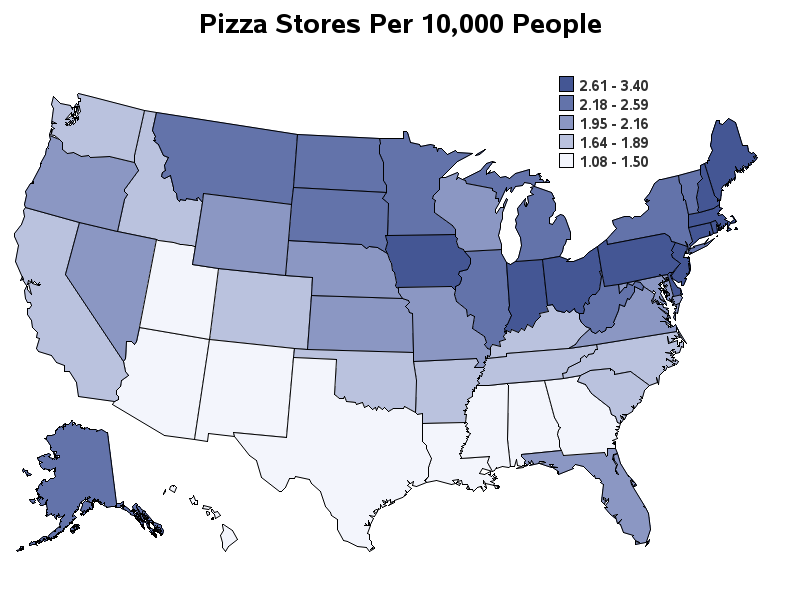
Pizza per Person
These samples courtesy of Robert Allison
Please see the following README