by: Robert Allison
Yay! - SAS 9.4 has lots of SAS/GRAPH additions & enhancements. I'm including examples of a few of my favorites below, and hopefully these simple examples will get you up-to-speed and using these new features quickly, once you get SAS 9.4.
Consistency, consistency, consistency - there's something to be said for that!
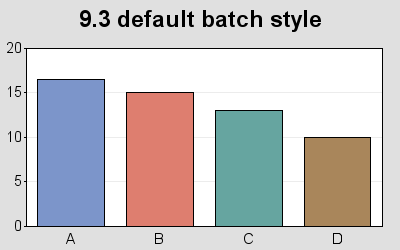
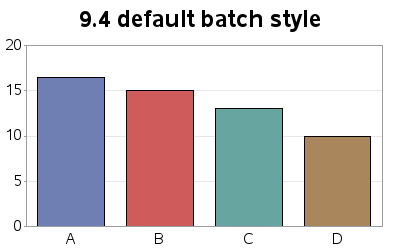
When you run SAS/GRAPH in batch mode in SAS 9.4, the default ODS Graph style is now 'htmlblue'. The default for interactive DMS SAS was already changed to htmlblue in SAS 9.3, and Enterprise Guide's default has been changed from EGDefault to htmlblue as well. Now you will get more consistent default output, in more situations!
I almost always run my SAS jobs in batch, and always hard-coded a style to over-ride the default - now I no longer have to do that to get an acceptable graph. The htmlblue style makes the graphs easier to read (without the gray background), and should better suit more users.
Note that I don't typically recommend coloring each bar a different color, but I'm doing so in this case so you can easily see what the default colors are, for the default style. Click link to see sas code.
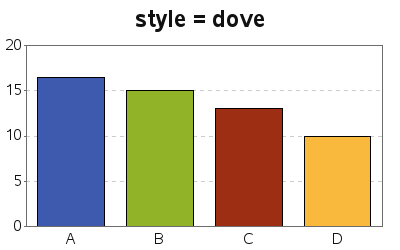
There are two new styles you can use with SAS 9.4 SAS/GRAPH - dove and raven. Unlike some of the older styles such as electronics and science (which are now deprecated), these new styles were designed to work well with ODS Graphics. Click link to see dove sas code and raven sas code.
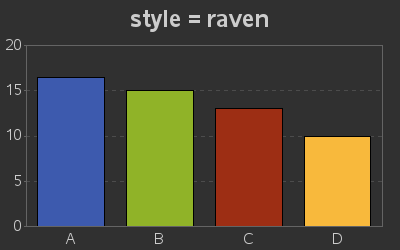
Remember, you can always submit the following code to see the list of supported/recommended ODS Graph styles for whatever version of SAS you're running:
   proc template;
   list styles;
   run;
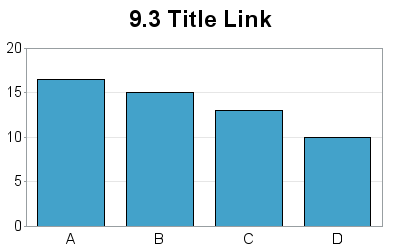
Previously, you could only specify a url link for the graph title. Now in SAS 9.4, you can also specify 'alt' text for the title. Html alt text is useful for adding additional description and details that you don't want to clutter the graph with, but that you want to make available on-demand (when the user hovers their mouse over the title). The alt text in the title also makes the graph more "accessible" to the blind -- for example, JAWS and Apple's VoiceOver can read the alt text to a blind user. Click link to see sas code.
title1 link="http://www.sas.com" alt="descriptive text" "Title Text";
Note that you'll need to click on the images/links below, and view the html page for each graph, to try out the links and alt text in the title:

Back in SAS 9.3 we added support for anti-aliasing (line smoothing) with device=png. Now in SAS 9.4 we've also added that capability to device=gif!
One caveat though is that gif images are still limited to 256 colors (this is a gif limitation, not a SAS limitation) and anti-aliasing will consume a few more colors for the shades of gray. So if you need a lot of colors in your graph, we still recommend you use device=png ... but if you really want a gif, you can now have one with smooth lines. Click link to see sas code.

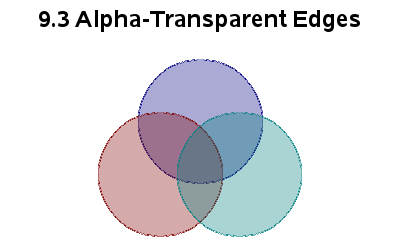
Back in SAS 9.3 we added support for Alpha Channel Color Transparency in device=png. Now in SAS 9.4, we've also added that capability for device=gif.
The alpha color name syntax is 'Arrggbbaa' where rr, gg, bb are the hex values for the level of red, green, blue (same as before), and aa is the hex values for alpha. An alpha value of 00 is completely transparent, and FF is completely solid. In the V9.4 example below, I use 'A1464F4aa' (blue) and 'AFFFF0077' (yellow) as the colors. Click link to see sas code.
In previous versions of SAS, you had to write out your own html file, therefore you had to modify a lot of code to switch between a non-animated graph and an animated one (and vice versa). In 9.4, ODS HTML handles this for you (just like your other graphs), which makes life a *lot* easier! :) Click link to see the 9.3 sas code and then compare it to the 9.4 sas code. Here's a bit of 9.4 code, below, so you can see how simple it is!
options dev=sasprtc printerpath=gif
 animduration=.4 animloop=0
 animoverlay=no animate=start;

ods listing close;
ods html path=odsout body="&name..htm" style=sasweb;

proc gchart data=foo;
by year;
vbar barnum / discrete type=sum sumvar=value
 noframe raxis=axis1 maxis=axis2
 width=8 space=4 des='' name="&name";
run;

quit;
ods html close;
ods listing;
Previously, you could create nice dev=png graphs, with anti-aliasing and alpha-transparent colors ... but if you wanted gif animations you had to do without anti-aliasing and alpha-transparent colors. Now in SAS 9.4, you can create gif animations with those features! Click link to see sas code.
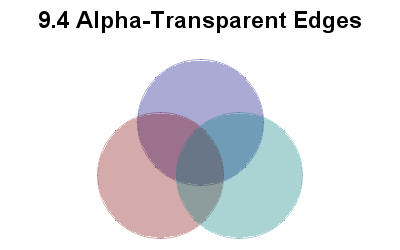
SAS 9.3 was the first version of SAS/GRAPH to support alpha-transparency, and it was still a little "rough around the edges" - literally. Notice in the examples below that the 9.3 annotated transparent pies had a dark/rough edge ... whereas they look much better in the 9.4 output. Click link to see sas code.
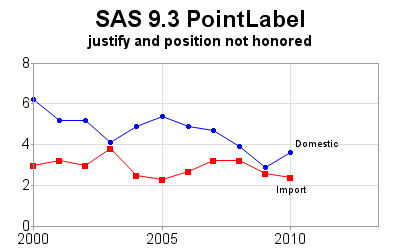
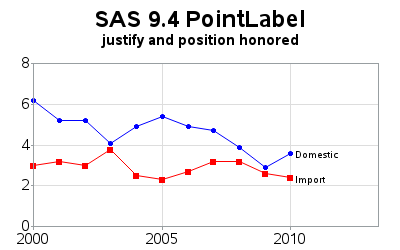
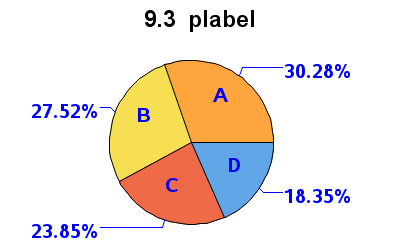
More options to specify & control the text in pointlabels was added in SAS 9.2 and 9.3. We continue to add even more text-controlling options in SAS 9.4 - this time, this time some options to better control the left/right and up/down placement of the text via 'justify' and 'position' options. Click link to see sas code.
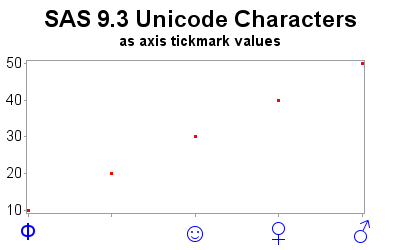
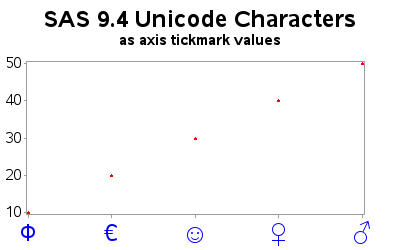
In SAS 9.2, we added support for using Unicode character codes to specify characters in a font. In SAS 9.3 we improved that capability, and in SAS 9.4 we get even closer to perfection! Previously, certain unicode characters didn't work in certain situations (for example, the Euro character '20AC'x in "albany amt/unicode" did not work when used as an axis tick mark value). That capability is now working in SAS 9.4! Click link to see sas code.
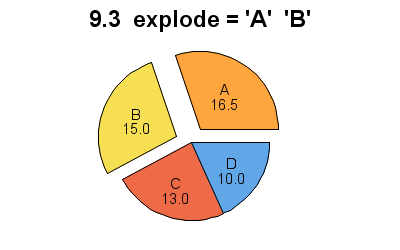
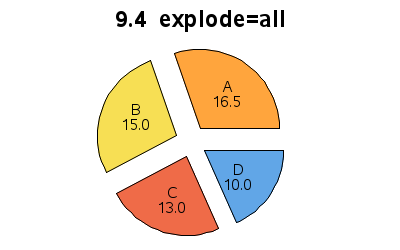
Previously, SAS allowed you to explode pie slices by explicitly specifying the name of the pie slice(s) with the 'explode=' option. If you wanted to explode all the slices, you had to specify them all ... and if the data changed you would have to change your code to specify all the new values. Now if you want to explode all the pie slices, you can use the new 'explode=all' option in SAS 9.4! Click link to see sas code.
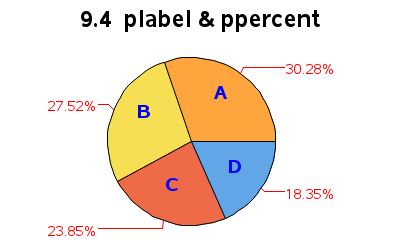
Previously, you could control the properties of the Proc Gchart pie labels using the 'plabel' option - but these properties got applied to *all* the labels. Now in SAS 9.4, there is a new option called 'ppercent' which lets you control the properties (color, font, and size) of the percent labels separately. Click link to see sas code.
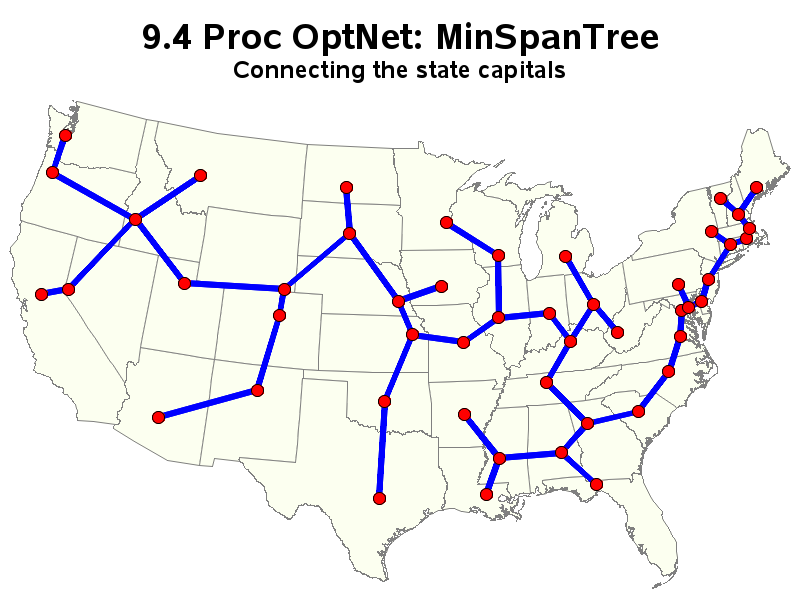
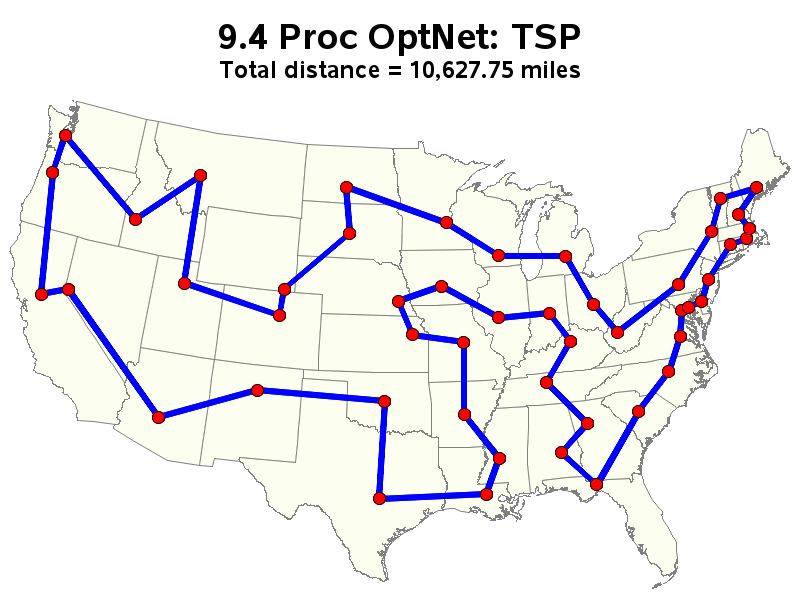
Technically, this is something new in SAS/OR, rather than SAS/GRAPH, but I'd like to mention it here because it ties in so well with Gmap. Also, it's technically new in 9.3m2 rather than 9.4 ... but since it's something new since 9.3, I'm including it here :)
Proc OptNet was added, which helps you determine optimal ways to connect various locations using algorithms for MinSpanTree, Traveling Salesman Problem (TSP), etc. Click link to see minspantree sas code and tsp sas code.
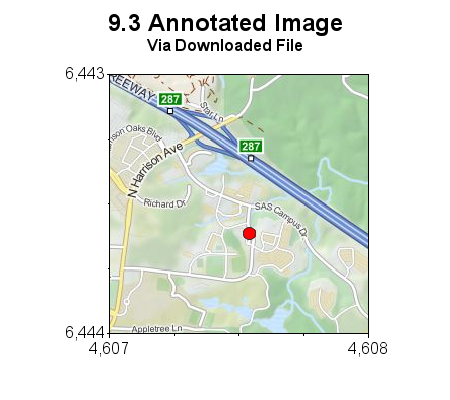
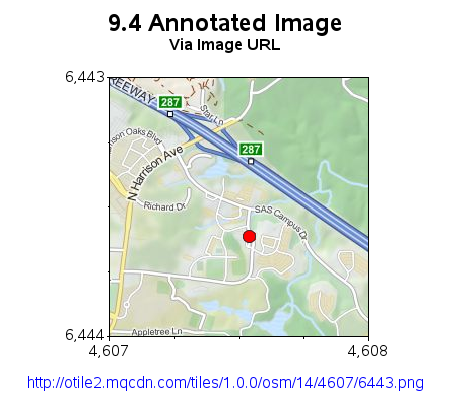
Previously, you could annotate images on your graphs, but if you wanted to annotate an image that was on the Web you had to first download the image to disk (either manually or via some 'tricky' SAS code), and then reference that disk copy in annotate imgpath variable in your annotate data set. Click link to see 9.3 sas code.
imgpath="C:\somefile.gif";
In SAS 9.4, you can now specify the Web URL of the image, and when the SAS code is run it will automatically download and use that image on-the-fly, without storing a permanent copy on your hard drive. Click link to see 9.4 sas code.
imgpath="http:someserver.com/somefile.gif";
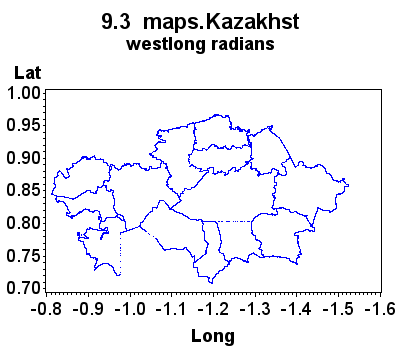
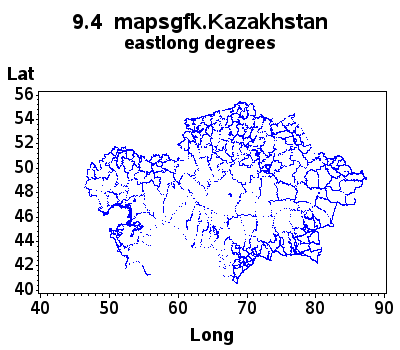
We still have the old maps in the 'maps' library (aka, "mapssas"). And the new maps are in the "mapsgfk" library. One difference you'll immediately notice is that the names are no longer limited to 8 characters, making the names easier to read (and easier to predict) ... for example, mapsgfk.Kazakhstan versus maps.Kazakhst. Another difference is that the new maps have their unprojected lat/long in eastlong degrees (whereas our previous maps were in westlong radians). And the new maps are more up-to-date, more accurate, and show more detail. The following examples is just a Gplot of the unprojected coordinates in one of the maps. Click this link to see the sas code.
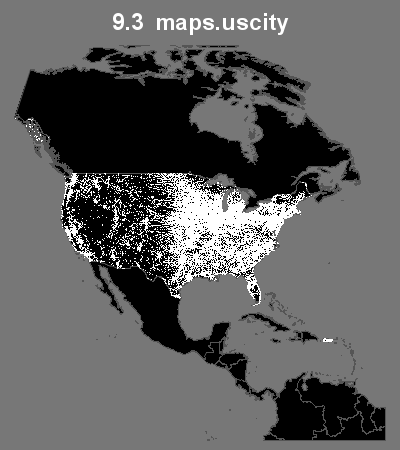
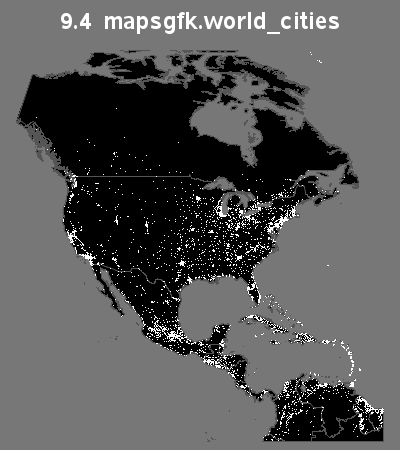
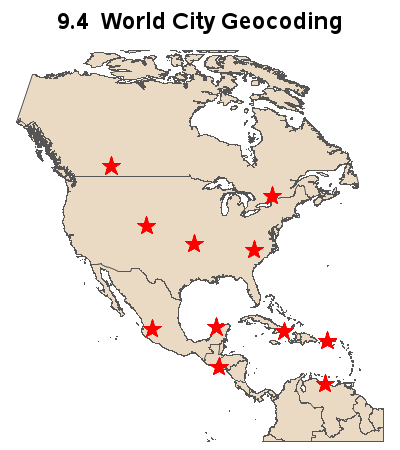
In previous versions of SAS, we shipped a maps.uscity data set which contained the latitude/longitude coordinates of U.S. cities. Now in SAS 9.4, we also ship a data set containing the coordinates of major cities throughout the world (mapsgfk.world_cities). Click link to see 9.3 sas code and the 9.4 sas code.
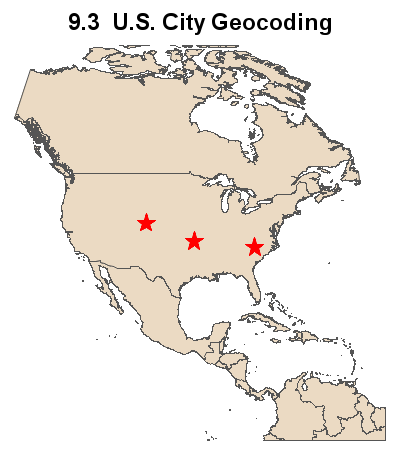
In SAS 9.3, Proc Geocode could lookup the lat/long for U.S. cities (using sashelp.zipcode). In SAS 9.4, Proc Geocode can lookup the lat/long for cities throughout the world (using mapsgfk.world_cities). Note that there are a few 'gotchas' - for example the spelling of the city names in your data must match the spelling in mapsgfk.world_cities exactly, and those GFK-supplied names are not always the English spelling. We'll probably do some fine-tuning of the world city geocoding in future releases. Click to see the 9.3 sas code. and the 9.4 sas code.
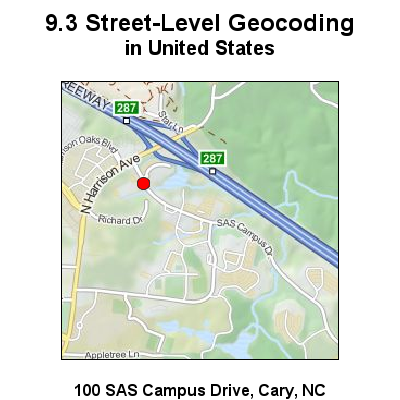
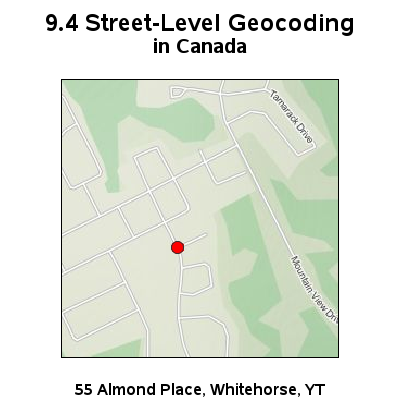
In SAS 9.3, Proc Geocode could do street-level geocoding for addresses in the United States. Now in SAS 9.4, you can also do street-level geocoding for some addresses in Canada. Click to see the 9.3 sas code. and the 9.4 sas code.
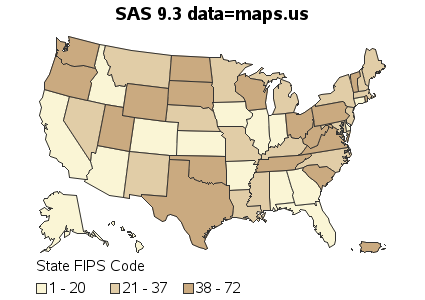
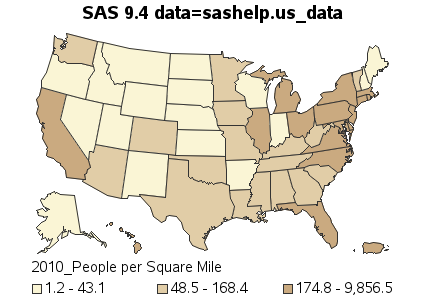
In SAS 9.3, if you wanted to create a simple/easy map to experiment with, there was not really any good simple response data to use. Therefore most users simply used the map geometry data set as the response data, and plotted the map 'id' as the response variable. The resulting map was not very meaningful, but this was the only "data" that was easily available.
Now in SAS 9.4, we include sashelp.us_data which contains a variety of real-world response data from the Census, for all the states in the U.S. For example, the following variables are included: division, region, population_2010, and density_2010. This now makes it easy to experiment with Proc Gmap, using meaningful real-world data! Click this link to see the sas code.
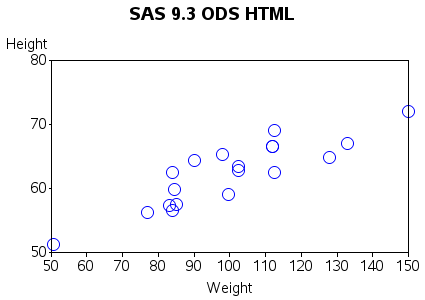
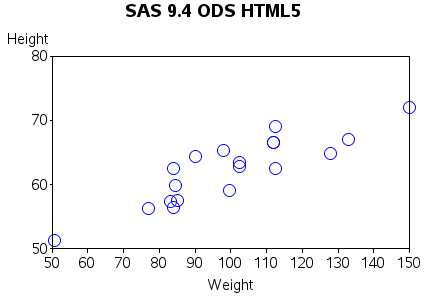
Previously, we typically used 'ods html' and device=png to create graphs, and the output would consist of an html file which pointed to a png file. Now, in 9.4, you can use 'ods html5' and produce the images 'inline' so that they're encoded as part of the html file. This can make it much easier to email a graph (with html charttips & drill down) to someone, since you only have 1 file, and don't have to worry about the relative or absolute pathname used in the html file to point to the png file, etc. Click this link to see the sas code used for this example.
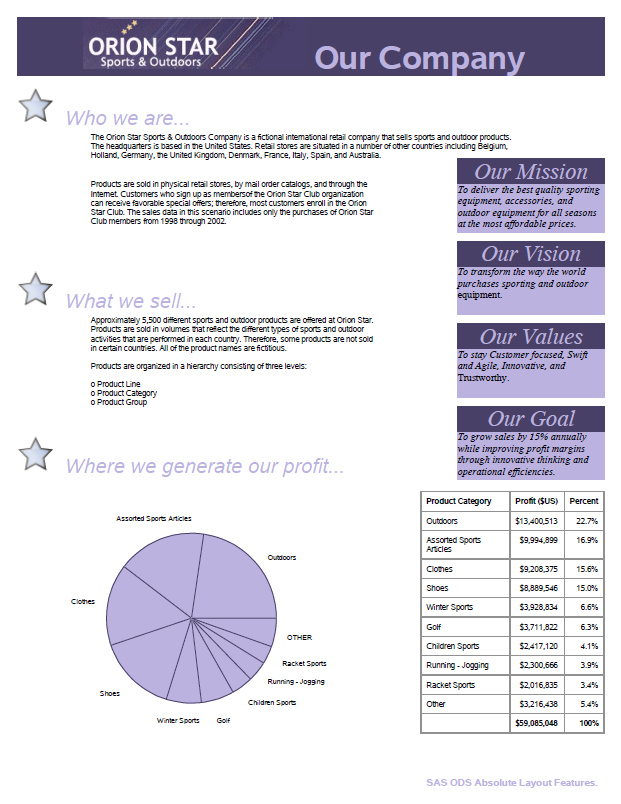
In SAS 9.4, ODS Layout is now *production*!
ODS Layout can be really helpful in creating custom dashboards, info-graphics, and custom reports/documents. It has the advantage over Proc Greplay in that you can mix both graphical proc, and tabular-proc output on the same page, and it will also work with non-traditional graphics procs such as Proc Gtile and Proc SGplot (whereas greplay only works with traditional sas/graph procs such as gplot, gchart, gmap, and gslide). Click this link to see the sas code used for this example.
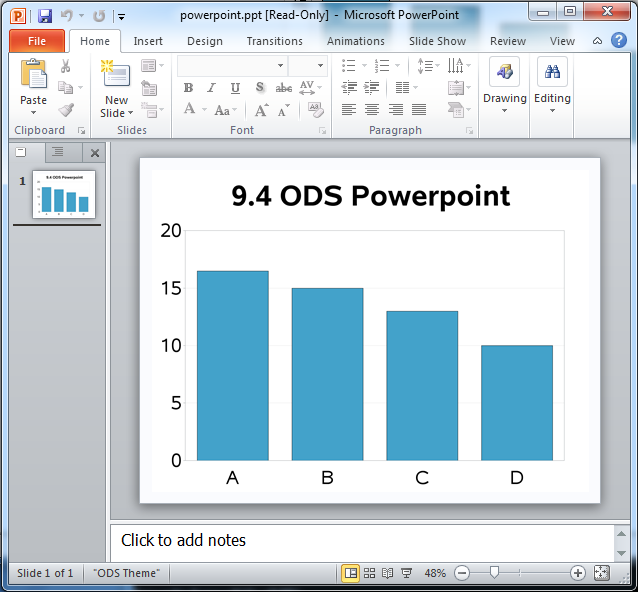
In SAS 9.4, you can write SAS/Graph output directly to a Powerpoint slide! You do this using "ods powerpoint", and the rest of your syntax remains mostly the same. Here's a screen capture of some sample output (below). Click this link to see the sas code.