Robert Allison's SAS/Graph Samples #66
Click on thumbnail to see full-size chart.
Click on label to see descriptions and SAS code.
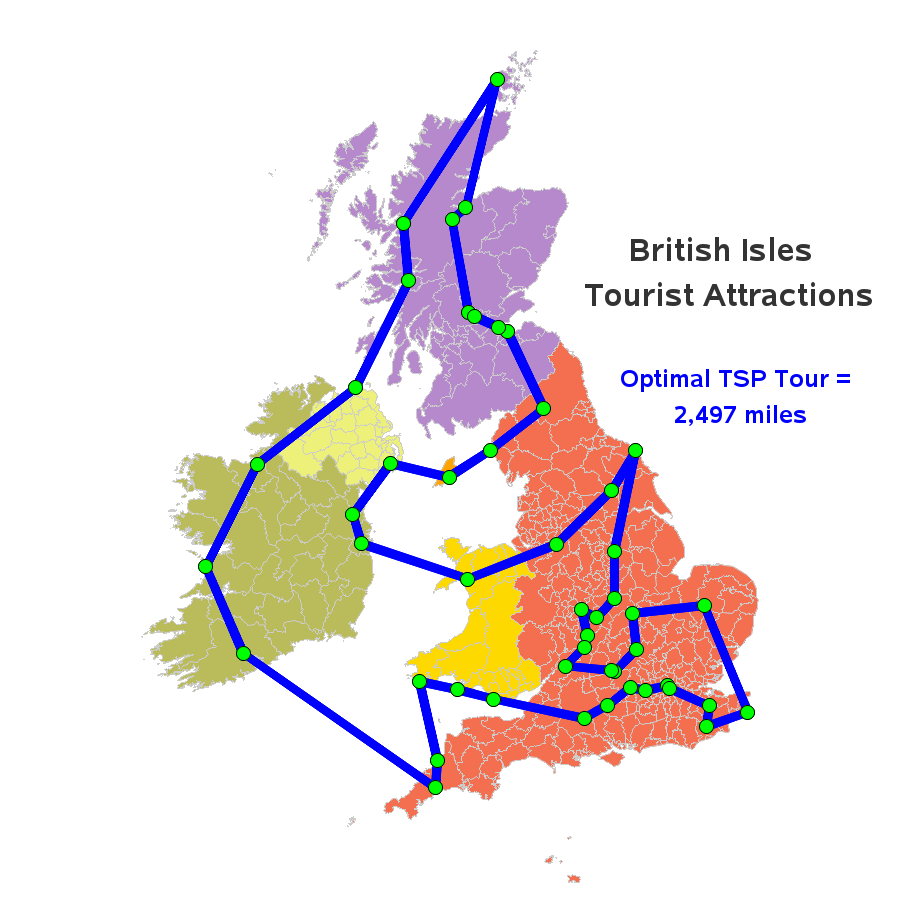
Optimal TSP Tour Map
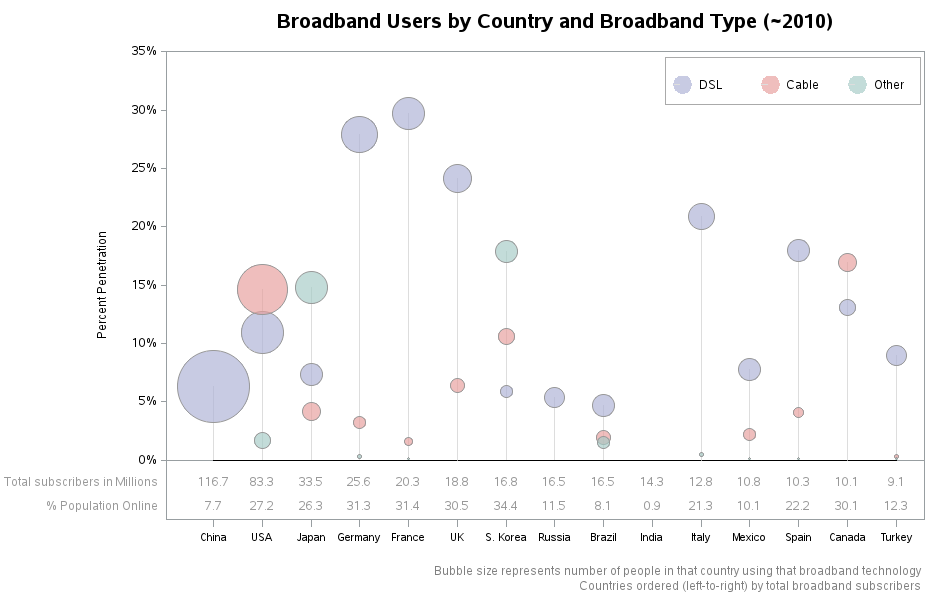
Broadband Penetration
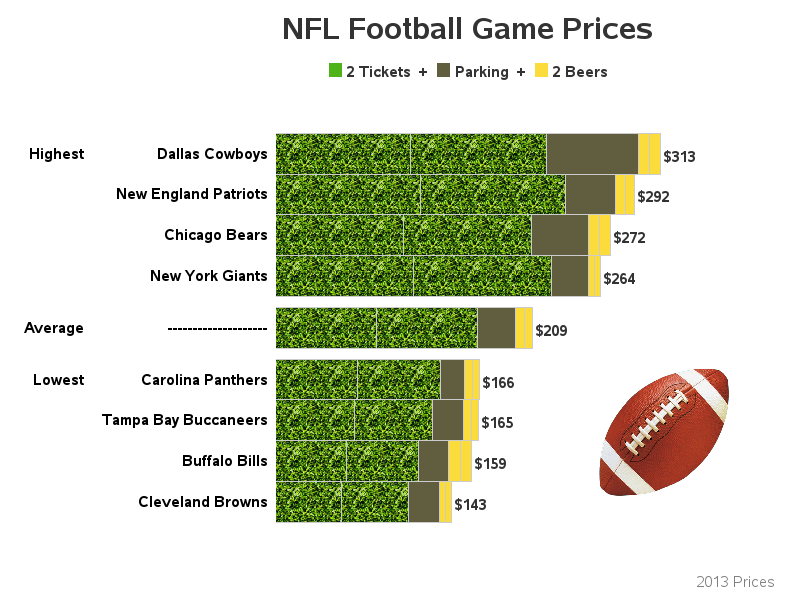
NFL Game Prices
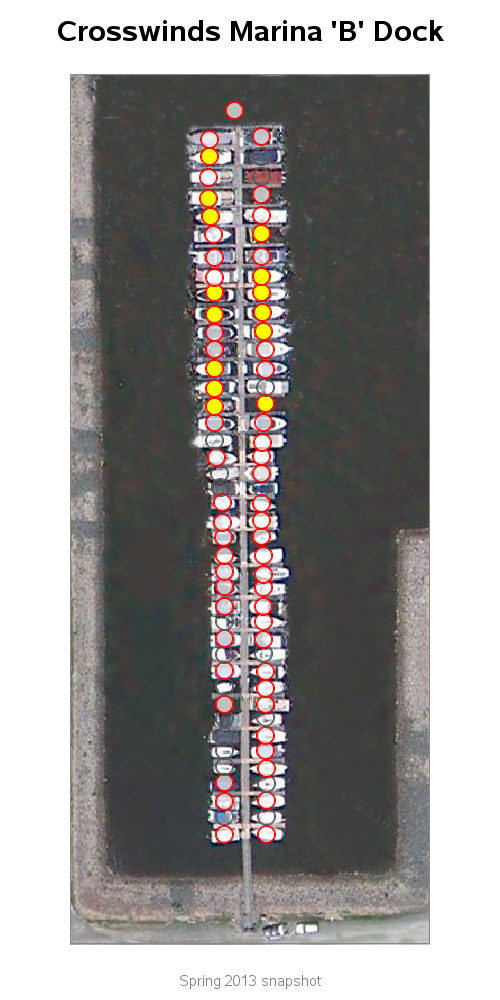
Marina Seating Chart
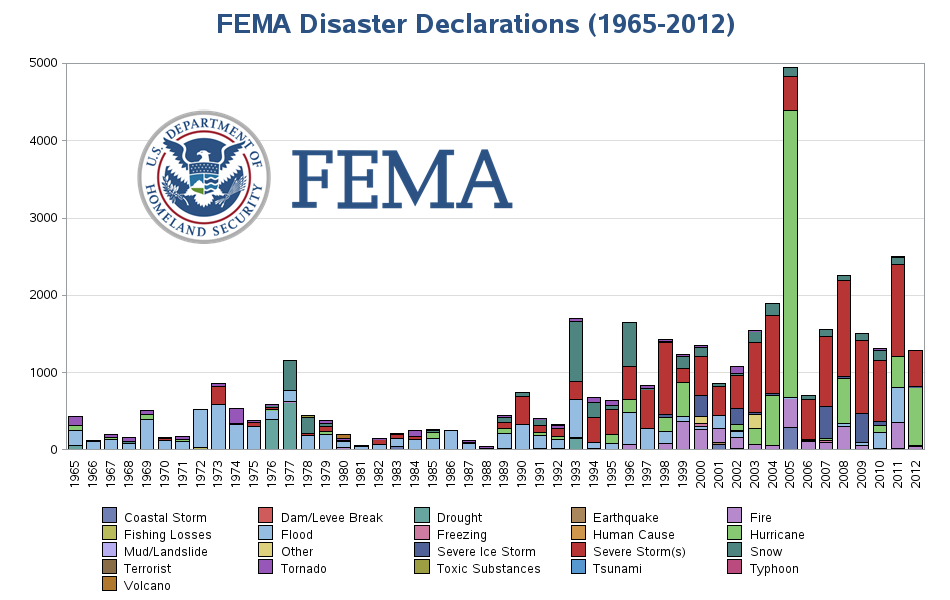
FEMA Disaster Charts
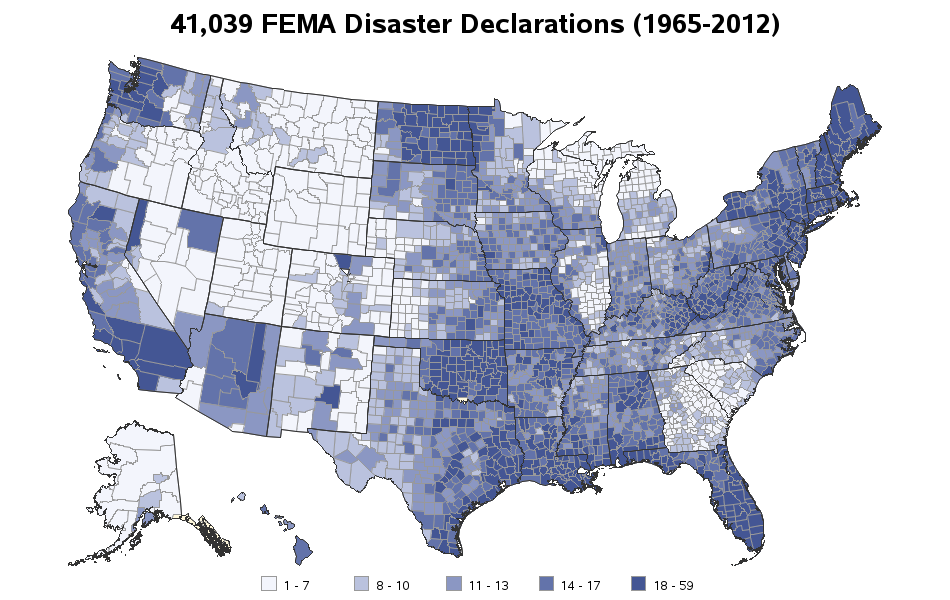
FEMA Disaster Maps
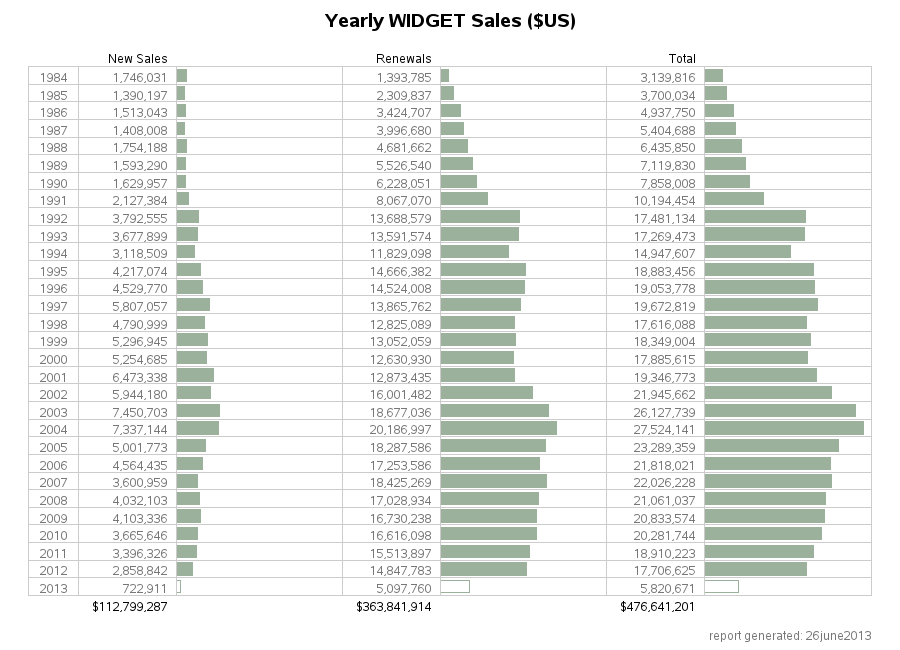
Sales Bar Table Chart
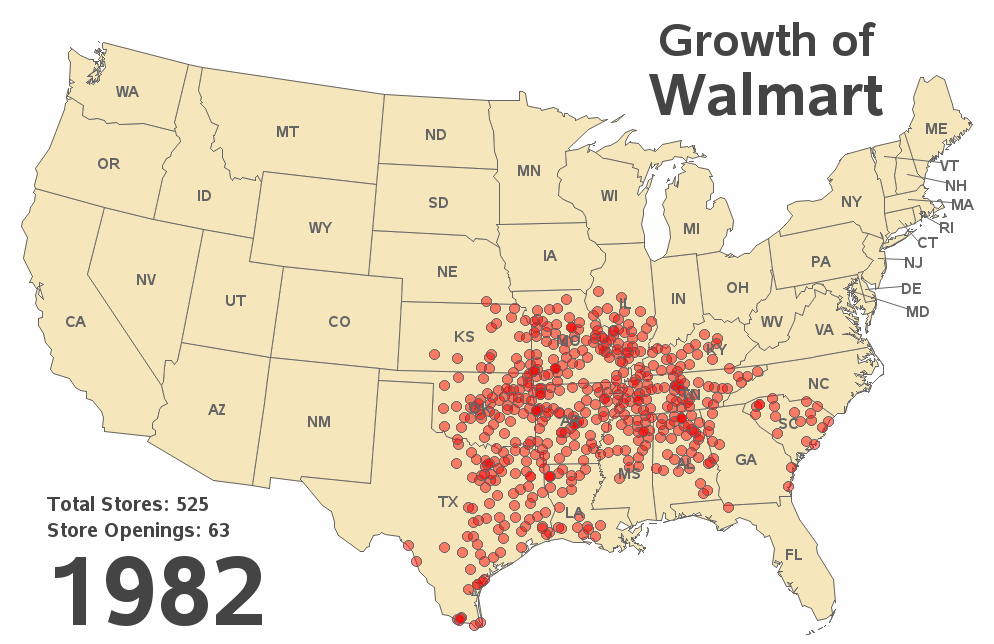
Growh of Walmart
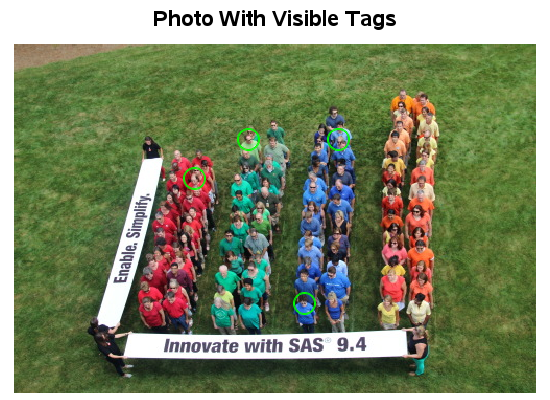
Tagging Photos in SAS
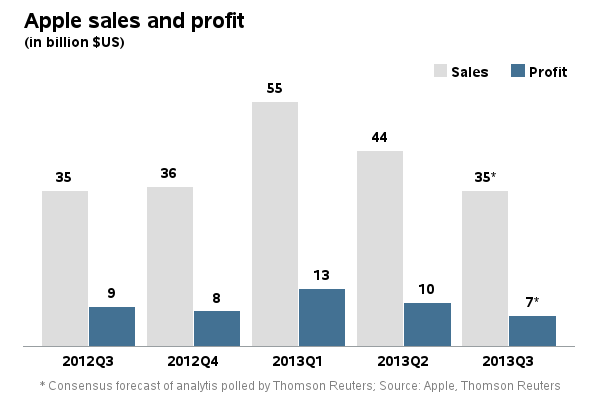
Apple's "Bad" Quarter
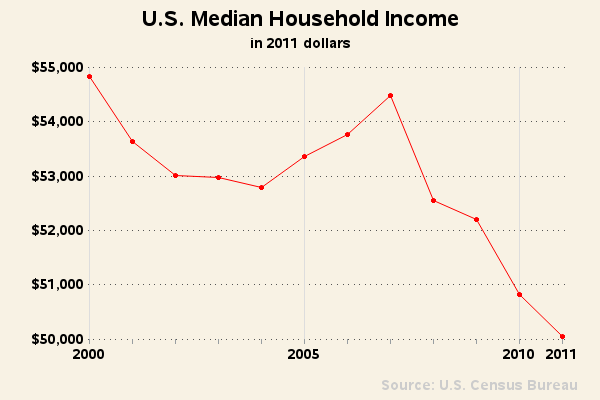
Median U.S. Income
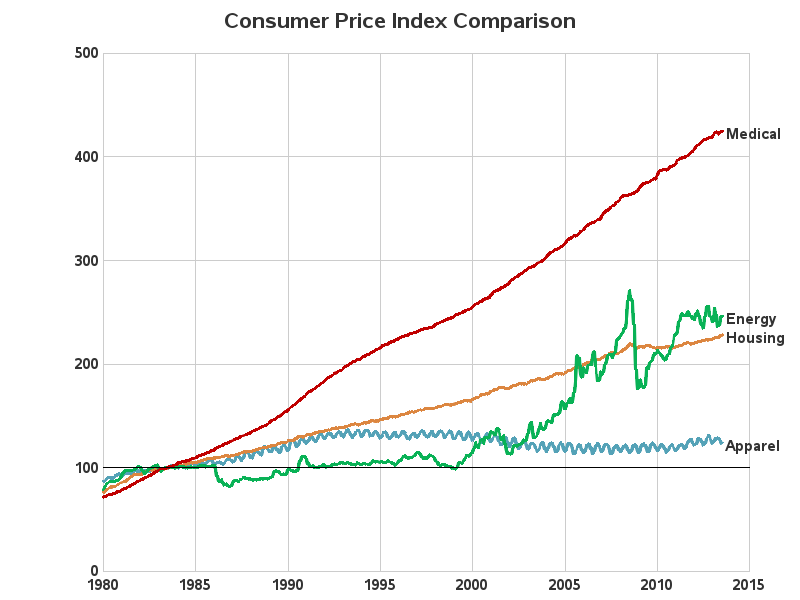
Consumer Price Index
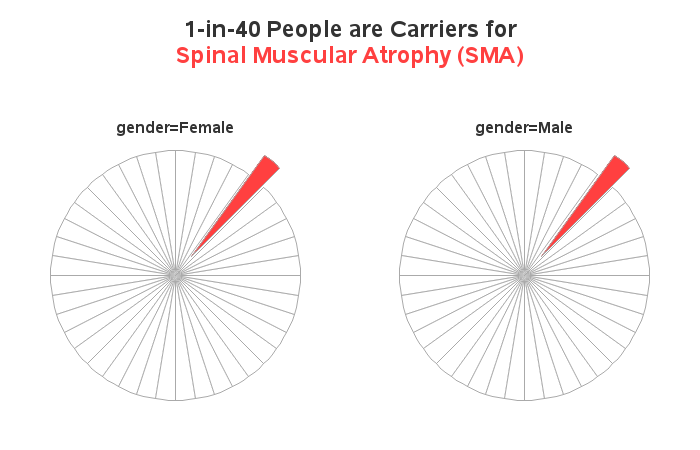
1-in-40 SMA Carriers
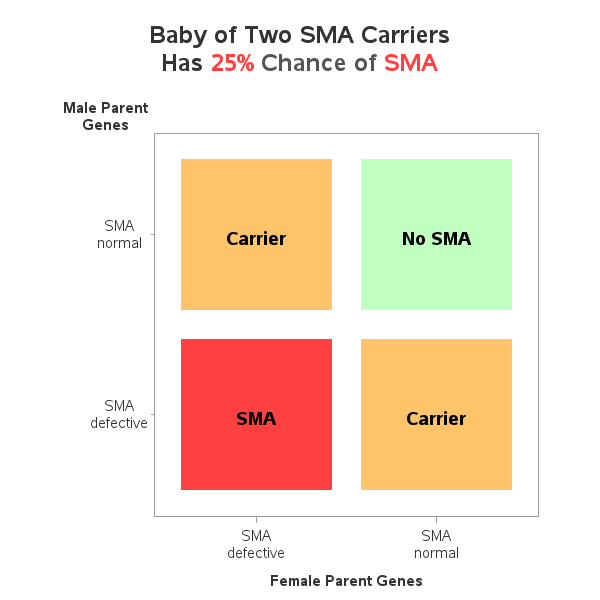
Grid of SMA Genetics
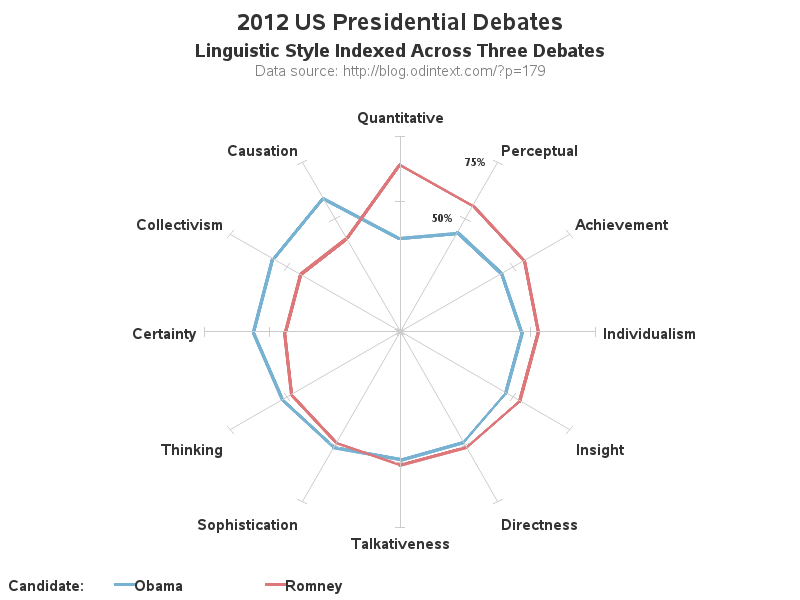
2012 President Debate
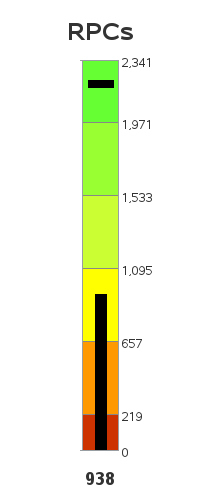
Vertical Bullet Graph
These samples courtesy of Robert Allison
Please see the following README