| 1 |
18JUN2014 |
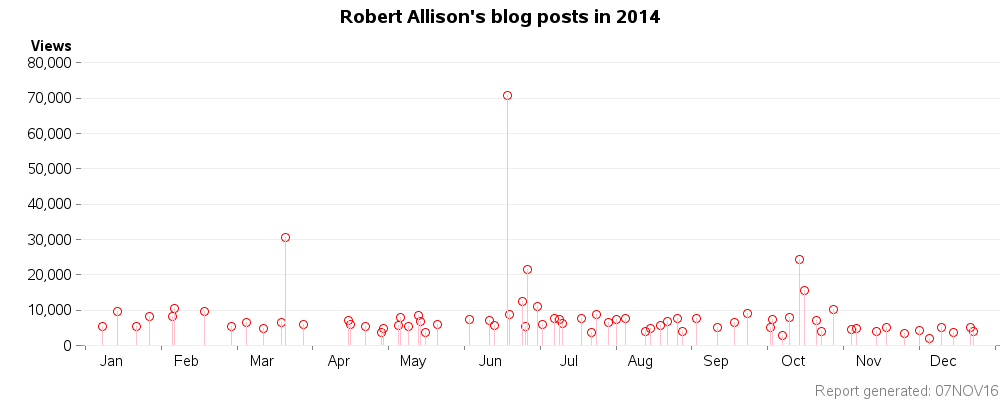
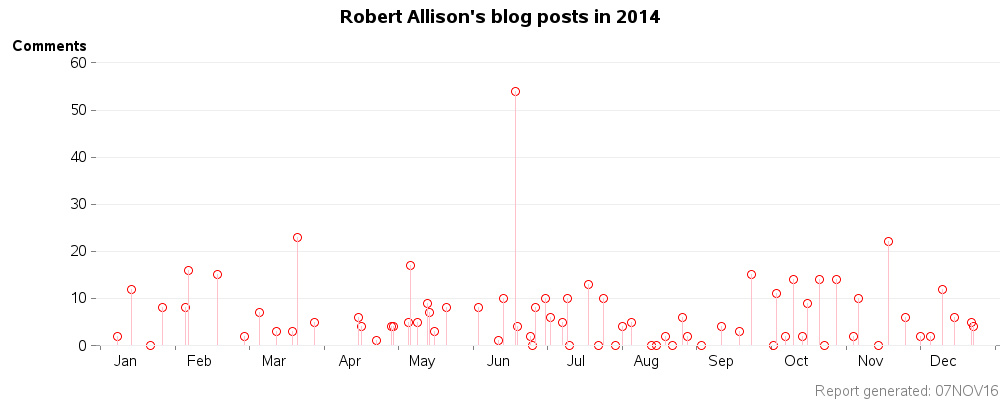
Free SAS Software for students! |
70,701 |
0 |
. |
54 |
| 2 |
21MAR2014 |
Airplanes that have disappeared without a trace! |
30,540 |
0 |
. |
23 |
| 3 |
14OCT2014 |
How does Amazon deliver packages so quickly? |
24,403 |
0 |
. |
2 |
| 4 |
26JUN2014 |
How to read Excel spreadsheets with SAS University Edition |
21,499 |
0 |
. |
8 |
| 5 |
16OCT2014 |
How do men rate women on dating websites? (Part 2) |
15,534 |
0 |
. |
9 |
| 6 |
24JUN2014 |
How to create a bubble plot in SAS University Edition |
12,357 |
0 |
. |
2 |
| 7 |
30JUN2014 |
Analytics, and winning soccer (fútbol) teams! |
10,950 |
0 |
. |
10 |
| 8 |
06FEB2014 |
How much snow does it take to close your school? (here's a SAS map!) |
10,510 |
0 |
. |
16 |
| 9 |
28OCT2014 |
Are you at risk? Which blood types do vampires prefer? |
10,251 |
0 |
. |
14 |
| 10 |
17FEB2014 |
Should teachers get a pay raise? |
9,583 |
0 |
. |
15 |
| 11 |
14JAN2014 |
Find out what 'holiday' your birthday is on! |
9,557 |
0 |
. |
12 |
| 12 |
23SEP2014 |
SAS on The Big Bang Theory TV series! |
9,060 |
0 |
. |
15 |
| 13 |
19JUN2014 |
How to create a histogram in SAS University Edition |
8,796 |
0 |
. |
4 |
| 14 |
24JUL2014 |
When did 'your music' become 'classic rock' |
8,753 |
0 |
. |
10 |
| 15 |
13MAY2014 |
Why people have 12 pairs of shoes and no health insurance |
8,376 |
0 |
. |
9 |
| 16 |
05FEB2014 |
Saving the monarch butterflies |
8,309 |
0 |
. |
8 |
| 17 |
27JAN2014 |
Mead - the drink of gods! |
8,142 |
0 |
. |
8 |
| 18 |
06MAY2014 |
SAS Wonder Twin powers ... activate! |
8,091 |
0 |
. |
17 |
| 19 |
10OCT2014 |
How do men rate women on dating websites? |
8,055 |
0 |
. |
14 |
| 20 |
07JUL2014 |
Where will the next earthquake strike? |
7,714 |
0 |
. |
5 |
| 21 |
26AUG2014 |
Will California dry up and fall off? |
7,706 |
0 |
. |
6 |
| 22 |
03SEP2014 |
Analyzing the Atlantic Coast Pipeline |
7,624 |
0 |
. |
0 |
| 23 |
05AUG2014 |
Tracking Ebola: Layering customized SAS maps |
7,608 |
0 |
. |
5 |
| 24 |
18JUL2014 |
Use SAS to help plan your next vacation! |
7,550 |
0 |
. |
13 |
| 25 |
03OCT2014 |
Which cars get the most speeding tickets? |
7,476 |
0 |
. |
11 |
| 26 |
09JUL2014 |
Live long and prosper ... but how long? |
7,452 |
0 |
. |
10 |
| 27 |
03JUN2014 |
Learn more about SAS and the state where it's made! |
7,448 |
0 |
. |
8 |
| 28 |
01AUG2014 |
Oh buoy! It's time for some Shark Week graphs! |
7,256 |
0 |
. |
4 |
| 29 |
21OCT2014 |
How cheap will gasoline prices go? |
7,137 |
0 |
. |
14 |
| 30 |
15APR2014 |
Cool SAS infographic, with custom 3-D effect |
7,120 |
0 |
. |
6 |
| 31 |
11JUN2014 |
Tracking sea turtles with SAS |
7,017 |
0 |
. |
1 |
| 32 |
22AUG2014 |
How to show recessions (or other ranges) on a time series plot |
6,956 |
0 |
. |
0 |
| 33 |
14MAY2014 |
A visual analysis of rising sea levels |
6,809 |
0 |
. |
7 |
| 34 |
18SEP2014 |
Shocking data about your electricity rate! |
6,662 |
0 |
. |
3 |
| 35 |
05MAR2014 |
Breaking Bad (data) with SAS! |
6,568 |
0 |
. |
7 |
| 36 |
19MAR2014 |
Creating SAS graphs for an international audience |
6,567 |
0 |
. |
3 |
| 37 |
29JUL2014 |
SQL Joins in SAS University Edition |
6,422 |
0 |
. |
0 |
| 38 |
10JUL2014 |
How to turn rows into columns in SAS University Edition |
6,135 |
0 |
. |
0 |
| 39 |
16APR2014 |
Why learn SAS instead of Excel? ... Medicare data |
6,048 |
0 |
. |
4 |
| 40 |
02JUL2014 |
Forecasting sharknadoes with SAS |
6,000 |
0 |
. |
6 |
| 41 |
21MAY2014 |
Planning meteor showers around your busy schedule! |
5,962 |
0 |
. |
8 |
| 42 |
28MAR2014 |
How could SAS be used to help find missing planes? |
5,962 |
0 |
. |
5 |
| 43 |
19AUG2014 |
Mapping 206 hospitals in 29 states! |
5,775 |
0 |
. |
2 |
| 44 |
13JUN2014 |
How many Friday the 13th will we have this year? |
5,570 |
0 |
. |
10 |
| 45 |
05MAY2014 |
What's the real U.S. unemployment rate? |
5,551 |
0 |
. |
5 |
| 46 |
22APR2014 |
How are your tax dollars spent? Let's graph it! |
5,540 |
0 |
. |
1 |
| 47 |
27FEB2014 |
Olympic graphs ... on steroids! |
5,368 |
0 |
. |
2 |
| 48 |
25JUN2014 |
How to create fancy statistical graphs in SAS University Edition |
5,365 |
0 |
. |
0 |
| 49 |
08JAN2014 |
Creating 'pretty' maps with SAS |
5,335 |
0 |
. |
2 |
| 50 |
09MAY2014 |
US labor participation rate and the 'axis of evil' |
5,330 |
0 |
. |
5 |
| 51 |
22JAN2014 |
Easy new way to send drilldown graphs in an email |
5,315 |
0 |
. |
0 |
| 52 |
11SEP2014 |
Does your county have a Mine-Resistant Ambush Protected vehicle? |
5,242 |
0 |
. |
4 |
| 53 |
02OCT2014 |
Analysis of credit scores, and automobile loans |
5,203 |
0 |
. |
0 |
| 54 |
18NOV2014 |
Hey! Where have you been?!? |
5,095 |
0 |
. |
22 |
| 55 |
22DEC2014 |
Santa's information dashboard - Version 2.0 |
5,072 |
0 |
. |
5 |
| 56 |
10DEC2014 |
10 most annoying airline seatmate behaviors |
5,056 |
0 |
. |
12 |
| 57 |
06NOV2014 |
Graphs that make you go hmm... (early voting data) |
4,965 |
0 |
. |
10 |
| 58 |
12MAR2014 |
Riddle: When is a bar chart really a pie chart? |
4,884 |
0 |
. |
3 |
| 59 |
29APR2014 |
Analyzing 60 years of tornado data with an animation |
4,838 |
0 |
. |
4 |
| 60 |
15AUG2014 |
What's trending in your neck of the woods? |
4,796 |
0 |
. |
0 |
| 61 |
04NOV2014 |
Sports analytics - visualize your results! |
4,648 |
0 |
. |
2 |
| 62 |
01DEC2014 |
Bringing order to holiday shopping chaos |
4,221 |
0 |
. |
2 |
| 63 |
28AUG2014 |
US public schools projected to be majority-minority in 2014 |
4,122 |
0 |
. |
2 |
| 64 |
23OCT2014 |
Tracking Ebola: Using SAS bubble maps |
4,042 |
0 |
. |
0 |
| 65 |
13AUG2014 |
If US state borders were redrawn -- which new state would you live in? |
4,019 |
0 |
. |
0 |
| 66 |
23DEC2014 |
Is more alcohol consumed during winter months? |
3,869 |
0 |
. |
4 |
| 67 |
14NOV2014 |
Are patent trolls finally on the decline? |
3,861 |
0 |
. |
0 |
| 68 |
15DEC2014 |
Where to find the cheapest gas |
3,815 |
0 |
. |
6 |
| 69 |
16MAY2014 |
How cold was it? - It was so cold that... |
3,740 |
0 |
. |
3 |
| 70 |
22JUL2014 |
I see spots ... sunspots! |
3,650 |
0 |
. |
0 |
| 71 |
28APR2014 |
Tornadoes: Picking up the pieces with SAS |
3,576 |
0 |
. |
4 |
| 72 |
25NOV2014 |
How a software geek prepares for the holidays |
3,326 |
0 |
. |
6 |
| 73 |
07OCT2014 |
The taxman cometh - for Amazon.com! |
2,921 |
0 |
. |
2 |
| 74 |
05DEC2014 |
Plotting the Corruption Perceptions Index using SAS |
2,134 |
0 |
. |
2 |