Robert Allison's SAS/Graph Samples #89
Click on thumbnail to see full-size chart.
Click on label to see descriptions and SAS code.
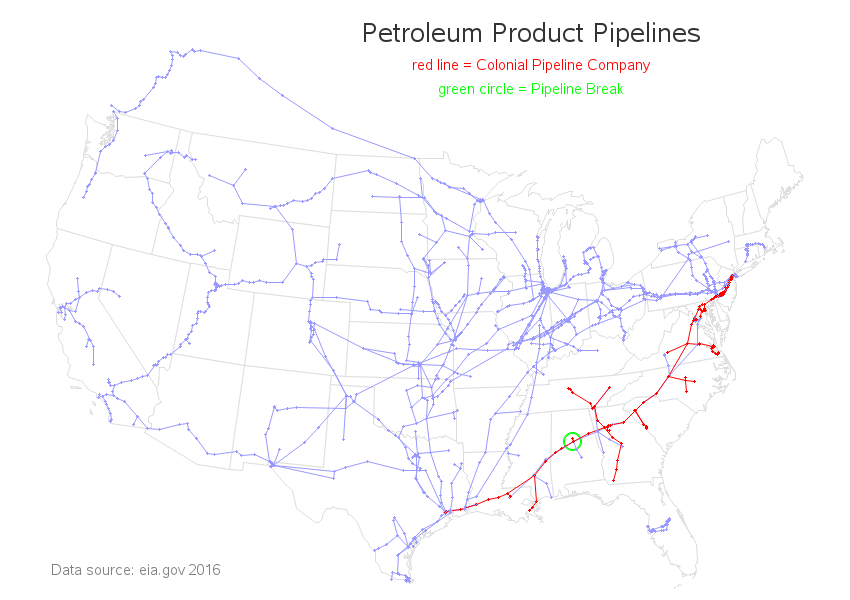

Gasoline Pipeline map
Statistics Crossword
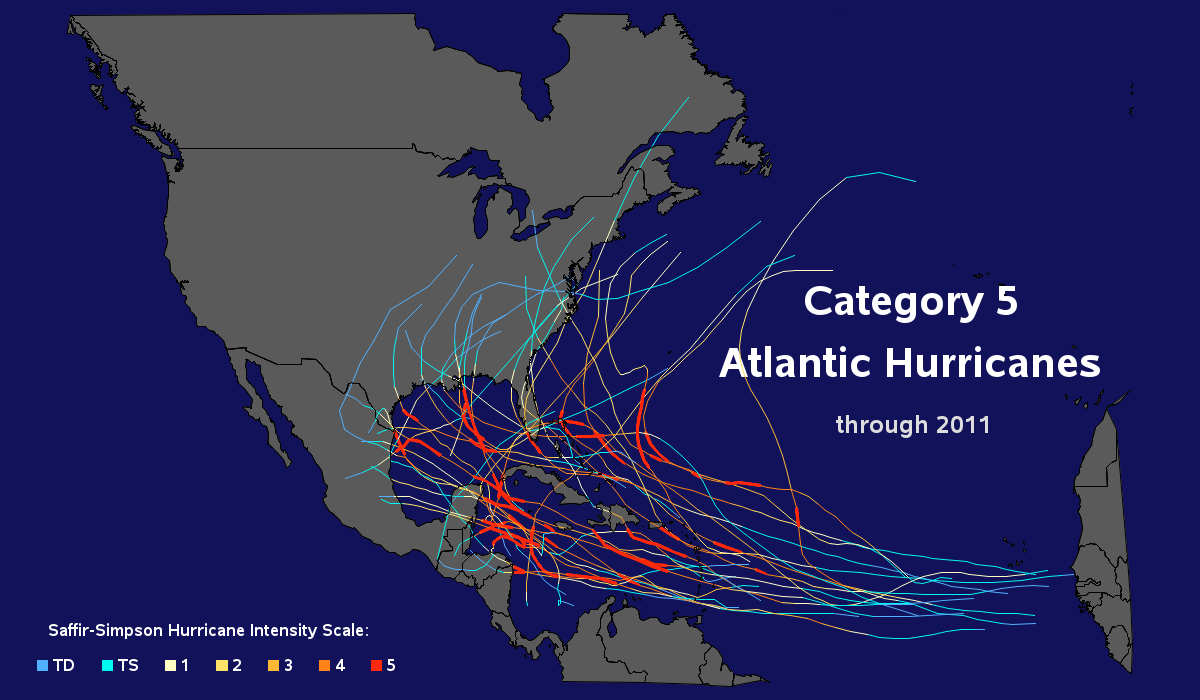
Cat. 5 Hurricanes
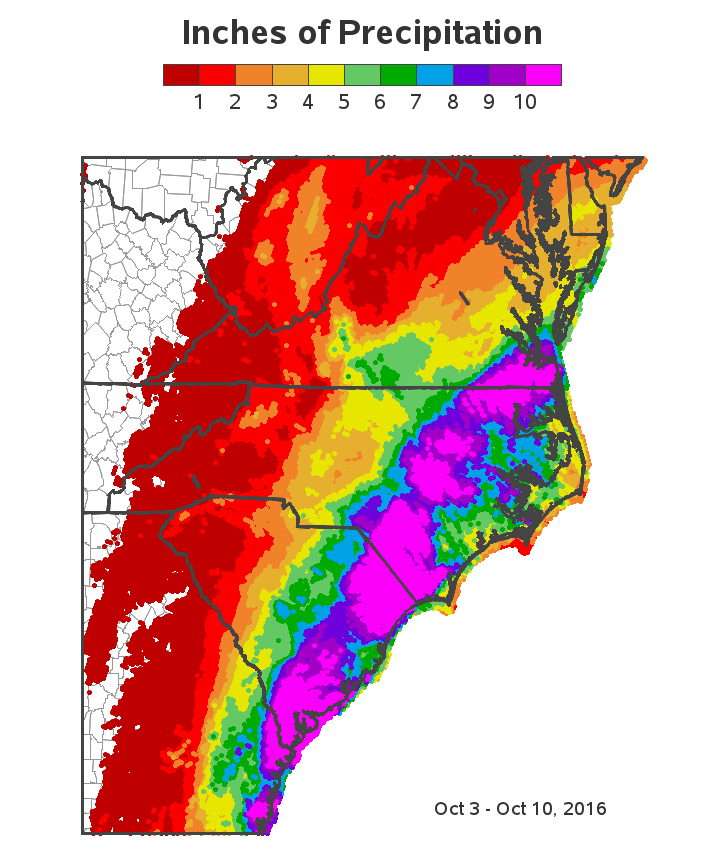
Hurricane Matthew
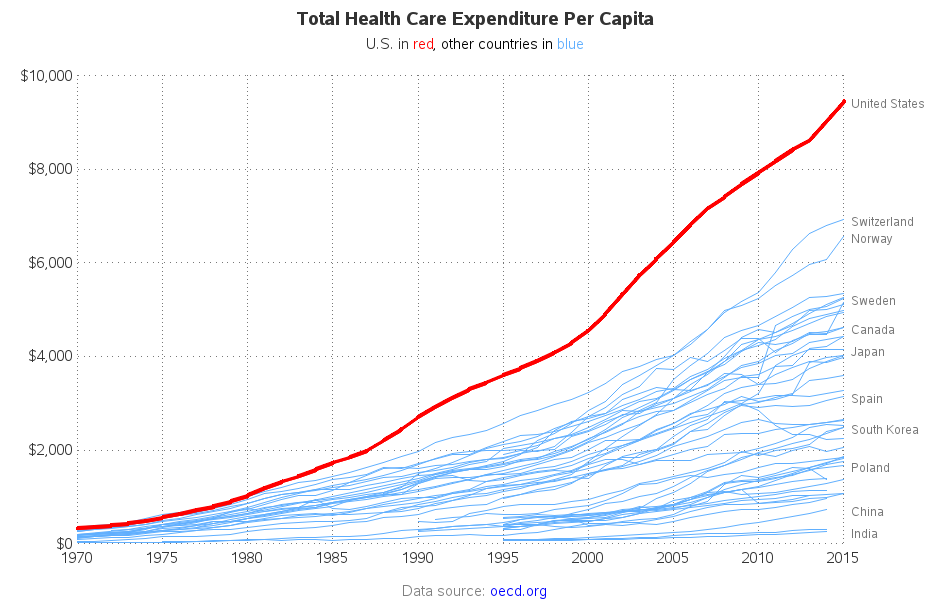
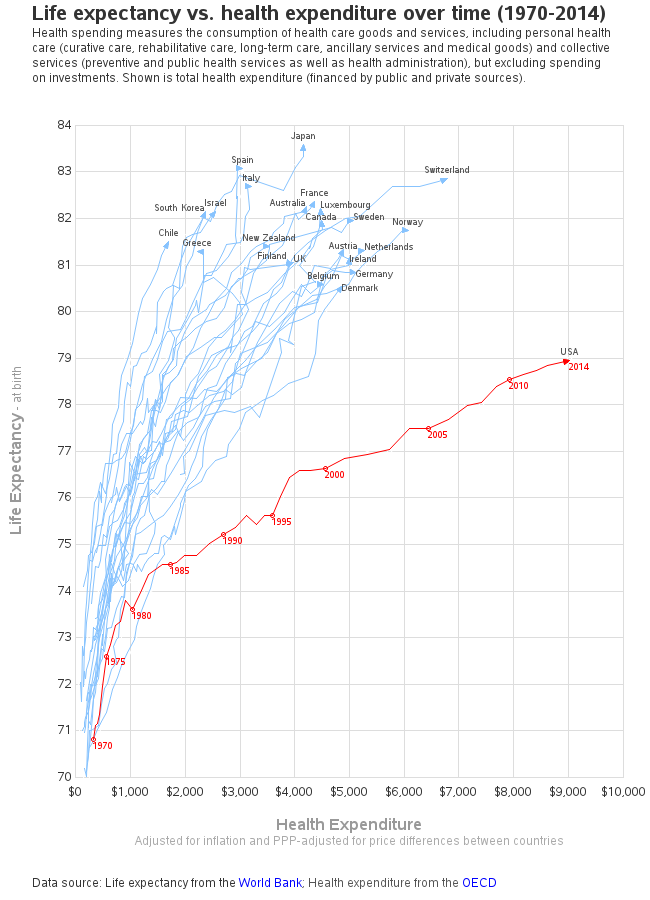

Health Care Spending
Longevity & Money
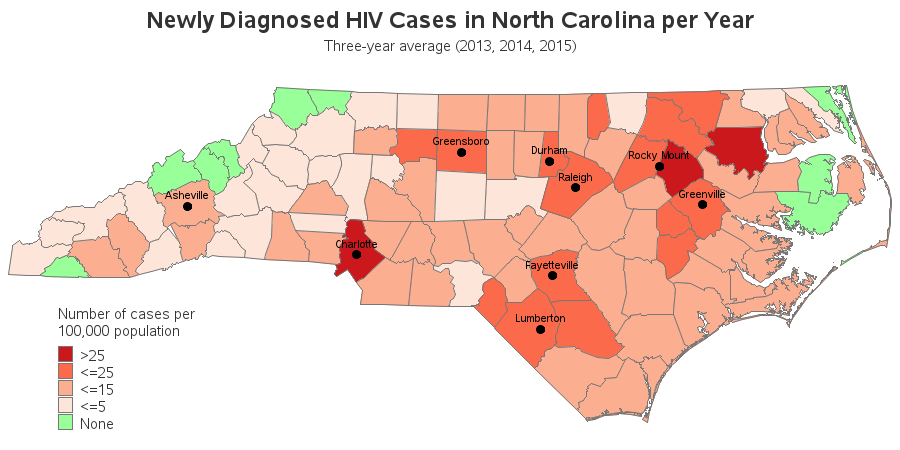
HIV Rate by County
Circles Illusion
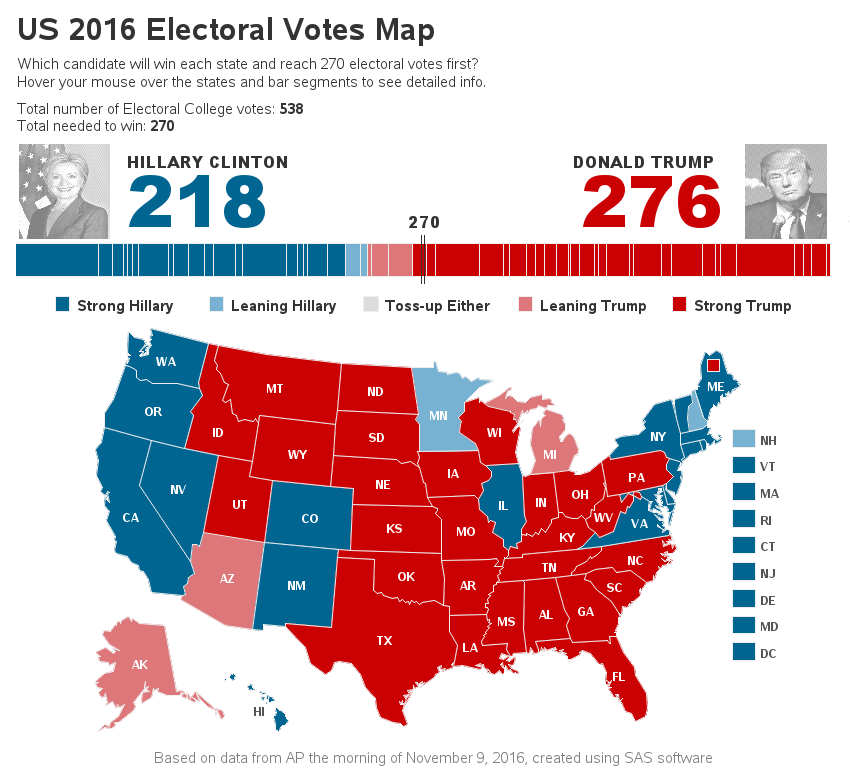
2016 U.S. Elections
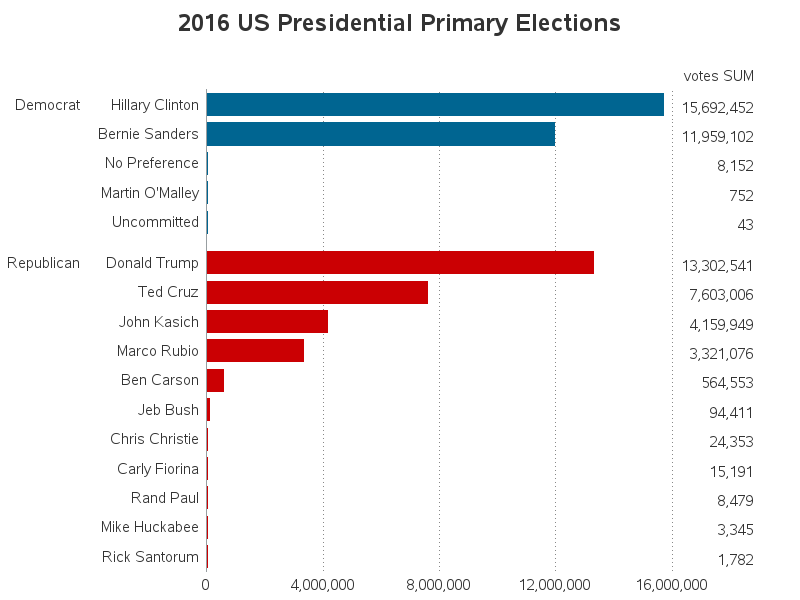
U.S. Election Primaries
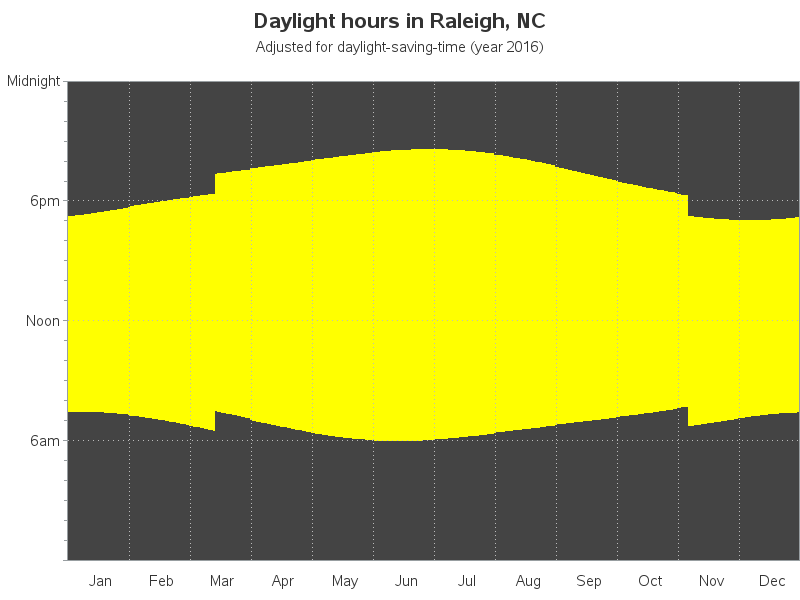
Hours of Daylight
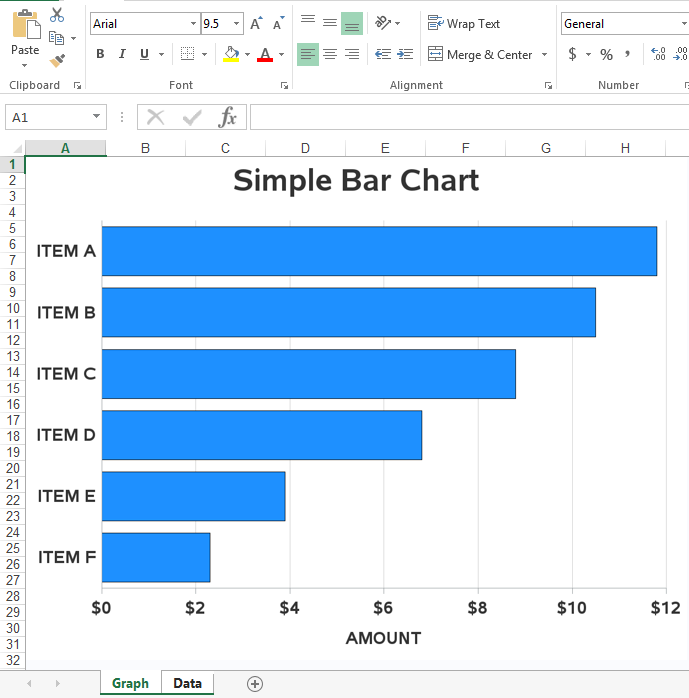
SAS Graph in Excel
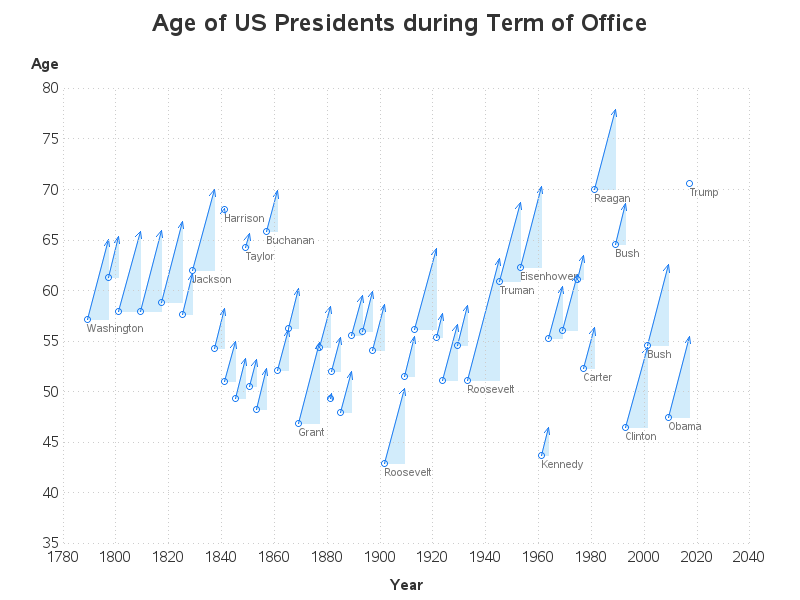
Presidents' Age Graph
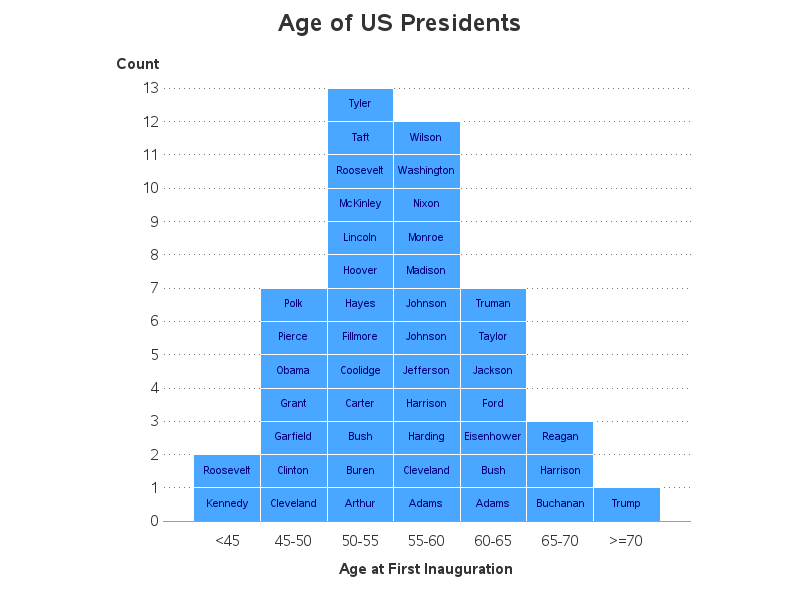
Presidents' Age Bar
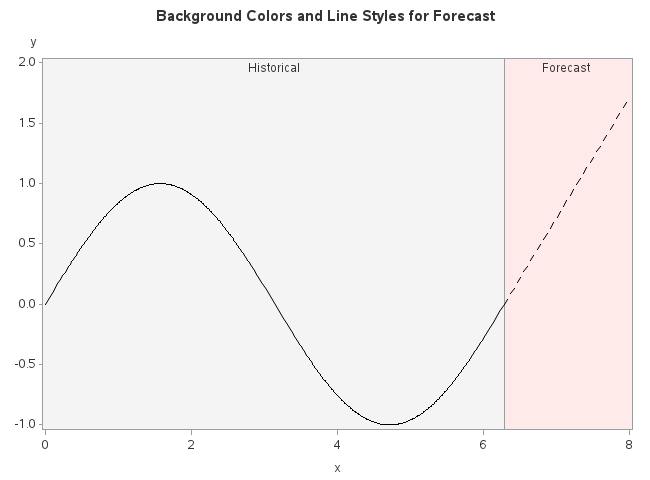
Shading the Forecast
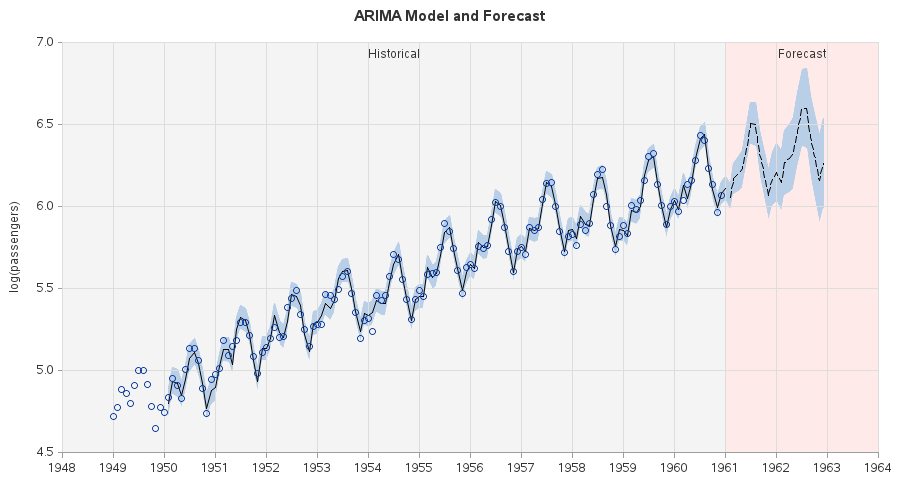
Shade Conf. Band
These samples courtesy of Robert Allison
Please see the following README