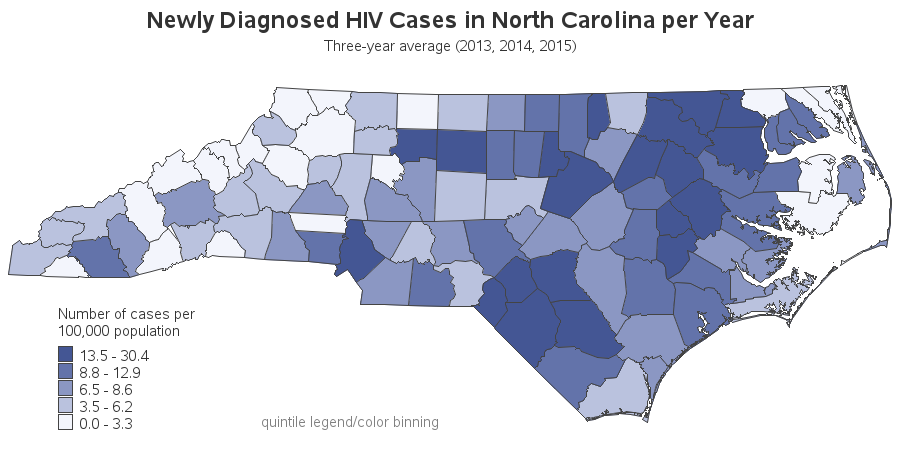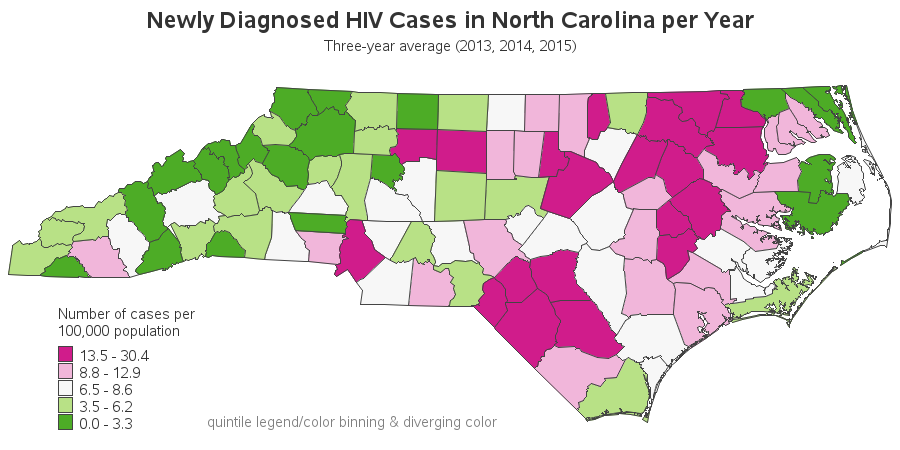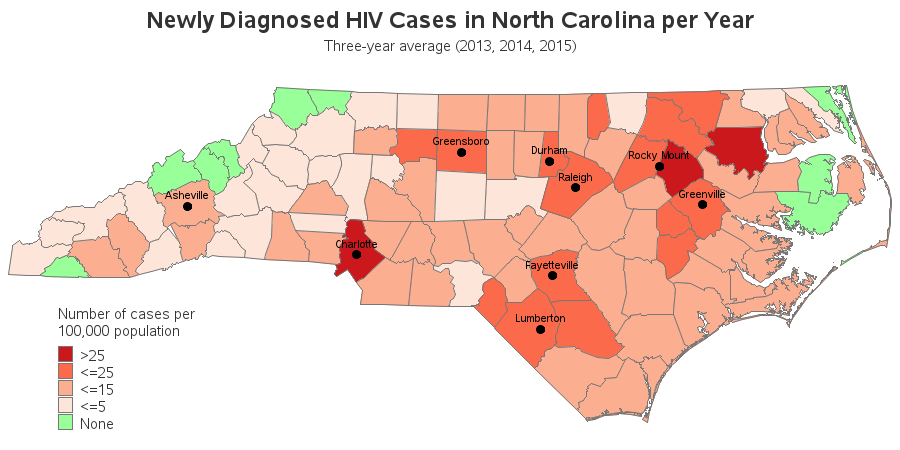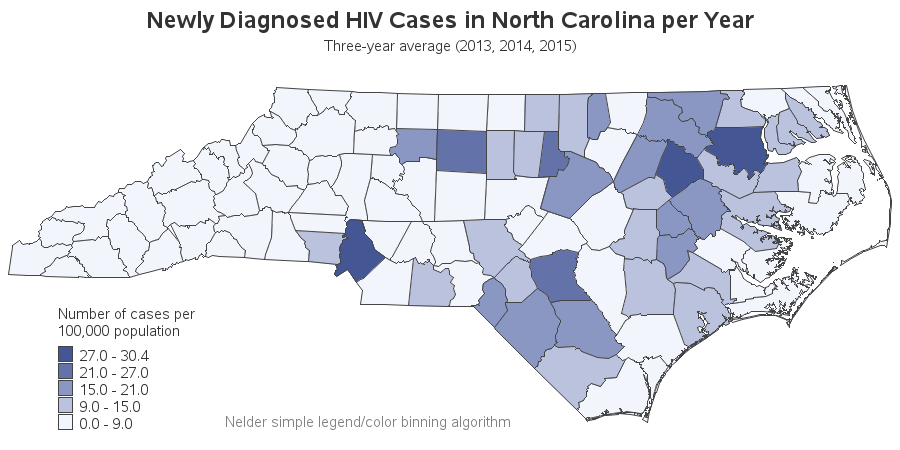
| Newly Diagnosed HIV Cases in North Carolina |
| Three Year Avg Rate per 100k |
County | Cases 2013 | Cases 2014 | Cases 2015 |
|---|---|---|---|---|
| 30.4 | Edgecombe | 18 | 16 | 16 |
| 27.9 | Bertie | 3 | 6 | 8 |
| 27.5 | Mecklenburg | 237 | 311 | 289 |
| 23.8 | Cumberland | 73 | 76 | 83 |
| 22.1 | Durham | 70 | 64 | 61 |
| 21.7 | Guilford | 116 | 97 | 121 |
| 20.4 | Pitt | 37 | 38 | 32 |
| 19.7 | Scotland | 1 | 8 | 12 |
| 19.4 | Northampton | 3 | 5 | 4 |
| 19.4 | Lenoir | 16 | 10 | 8 |
| 18.7 | Vance | 7 | 12 | 6 |
| 17.6 | Robeson | 21 | 21 | 29 |
| 16.4 | Halifax | 6 | 11 | 9 |
| 16.4 | Bladen | 9 | 3 | 5 |
| 15.7 | Greene | 3 | 4 | 3 |
| 15.5 | Forsyth | 65 | 50 | 55 |
| 15.2 | Nash | 12 | 16 | 15 |
| 15.1 | Wake | 165 | 152 | 135 |
| 13.7 | Hertford | 5 | 3 | 2 |
| 13.5 | Hoke | 7 | 9 | 5 |
| 12.9 | Columbus | 6 | 8 | 8 |
| 12.7 | Person | 7 | 3 | 5 |
| 12.6 | Wayne | 18 | 12 | 17 |
| 12.3 | Gaston | 27 | 20 | 31 |
| 11.6 | Anson | 3 | 3 | 3 |
| 11.4 | Wilson | 7 | 13 | 8 |
| 11.3 | Martin | 4 | 0 | 4 |
| 11.2 | Duplin | 7 | 4 | 9 |
| 10.9 | Onslow | 15 | 22 | 24 |
| 10.9 | Pasquotank | 7 | 4 | 2 |
| 10.9 | Alamance | 20 | 17 | 14 |
| 10.6 | Washington | 0 | 4 | 0 |
| 9.9 | Perquimans | 0 | 2 | 2 |
| 9.8 | Jones | 2 | 1 | 0 |
| 9.8 | Beaufort | 6 | 6 | 2 |
| 9.7 | Granville | 7 | 4 | 6 |
| 9.3 | Moore | 6 | 11 | 9 |
| 9.1 | Chowan | 2 | 1 | 1 |
| 9.0 | Orange | 14 | 10 | 14 |
| 8.8 | Macon | 3 | 3 | 3 |
| 8.6 | Craven | 10 | 8 | 9 |
| 8.5 | Dare | 4 | 1 | 4 |
| 8.5 | Montgomery | 3 | 3 | 1 |
| 8.4 | Harnett | 9 | 11 | 12 |
| 8.4 | Buncombe | 21 | 21 | 21 |
| 8.4 | Lee | 4 | 4 | 7 |
| 8.3 | Cleveland | 9 | 7 | 8 |
| 8.1 | New Hanover | 13 | 13 | 27 |
| 8.1 | Johnston | 16 | 15 | 13 |
| 8.0 | Cabarrus | 16 | 18 | 12 |
| 7.7 | Pamlico | 1 | 2 | 0 |
| 7.7 | Pender | 3 | 7 | 3 |
| 7.5 | Catawba | 9 | 14 | 12 |
| 7.4 | Franklin | 7 | 1 | 6 |
| 7.3 | Sampson | 5 | 6 | 3 |
| 7.2 | Caswell | 2 | 0 | 3 |
| 6.9 | Union | 13 | 15 | 17 |
| 6.7 | Rowan | 5 | 12 | 11 |
| 6.5 | Davidson | 13 | 9 | 10 |
| 6.5 | Jackson | 2 | 4 | 2 |
| 6.2 | Brunswick | 9 | 8 | 5 |
| 6.0 | Stanly | 3 | 7 | 1 |
| 5.8 | Carteret | 3 | 5 | 4 |
| 5.4 | Henderson | 2 | 5 | 11 |
| 5.3 | Yadkin | 1 | 3 | 2 |
| 5.1 | Rockingham | 2 | 7 | 5 |
| 5.0 | Surry | 7 | 1 | 3 |
| 4.9 | Warren | 1 | 0 | 2 |
| 4.9 | Cherokee | 2 | 1 | 1 |
| 4.7 | Swain | 1 | 1 | 0 |
| 4.5 | Alexander | 1 | 4 | 0 |
| 4.4 | Mcdowell | 4 | 1 | 1 |
| 4.4 | Watauga | 2 | 2 | 3 |
| 4.4 | Iredell | 9 | 5 | 8 |
| 4.4 | Richmond | 1 | 4 | 1 |
| 4.3 | Chatham | 4 | 0 | 5 |
| 4.1 | Burke | 5 | 0 | 6 |
| 3.8 | Graham | 1 | 0 | 0 |
| 3.5 | Rutherford | 1 | 1 | 5 |
| 3.5 | Randolph | 5 | 6 | 4 |
| 3.3 | Lincoln | 5 | 0 | 3 |
| 3.3 | Polk | 0 | 2 | 0 |
| 3.2 | Camden | 0 | 0 | 1 |
| 2.9 | Wilkes | 4 | 1 | 1 |
| 2.9 | Caldwell | 2 | 1 | 4 |
| 2.9 | Gates | 1 | 0 | 0 |
| 2.8 | Haywood | 1 | 2 | 2 |
| 1.9 | Avery | 0 | 0 | 1 |
| 1.4 | Stokes | 1 | 0 | 1 |
| 1.0 | Transylvania | 1 | 0 | 0 |
| 0.8 | Davie | 0 | 0 | 1 |
| 0.0 | Alleghany | 0 | 0 | 0 |
| 0.0 | Ashe | 0 | 0 | 0 |
| 0.0 | Clay | 0 | 0 | 0 |
| 0.0 | Currituck | 0 | 0 | 0 |
| 0.0 | Hyde | 0 | 0 | 0 |
| 0.0 | Madison | 0 | 0 | 0 |
| 0.0 | Mitchell | 0 | 0 | 0 |
| 0.0 | Tyrrell | 0 | 0 | 0 |
| 0.0 | Yancey | 0 | 0 | 0 |