Robert Allison's SAS/Graph Examples
For The Energy Sector
Click on thumbnail to see full-size chart.
Click on label to see descriptions and SAS code.
![]()
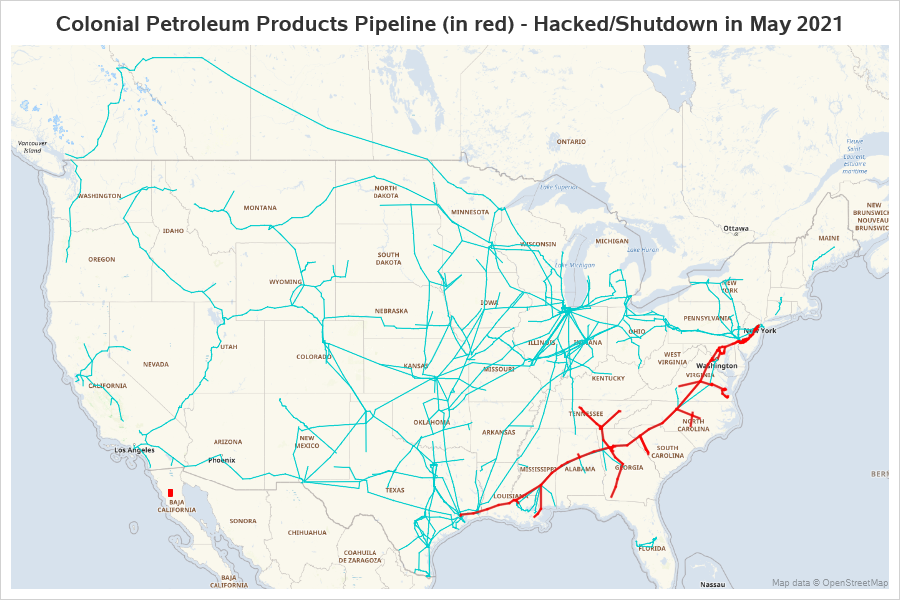
Hacked US Pipeline
Nuclear Power Plants
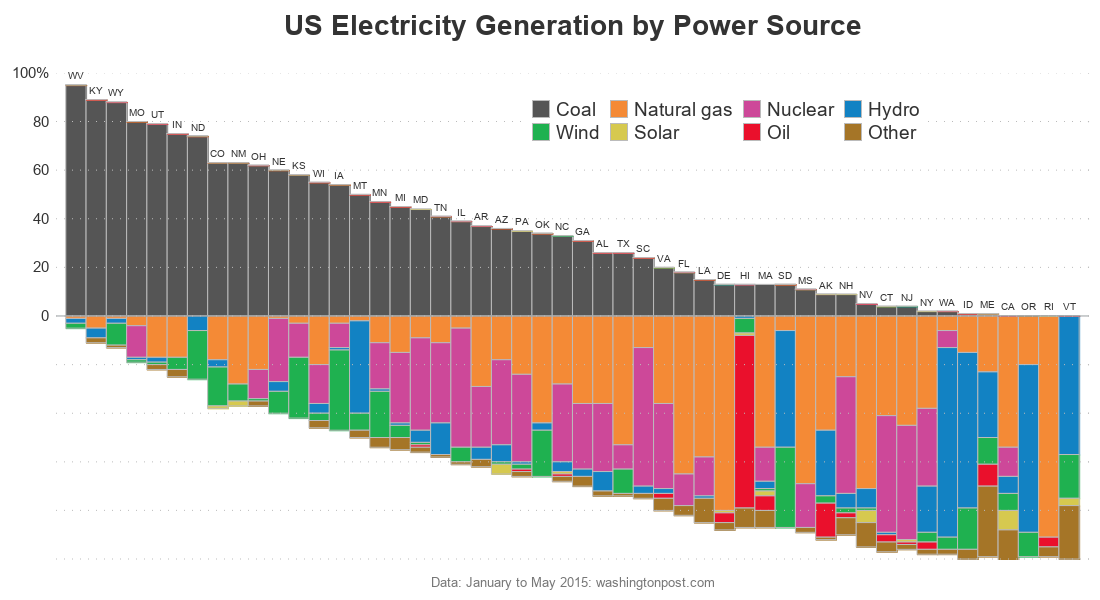
State Power Sources
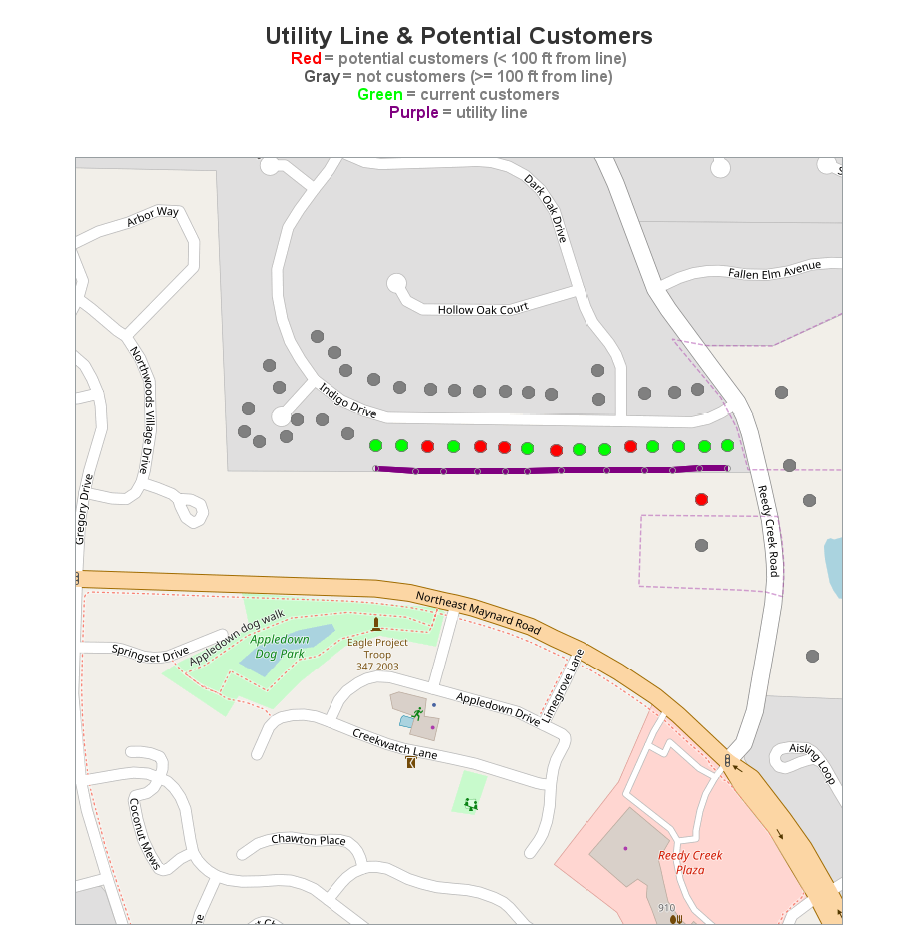
Utility Line Planning
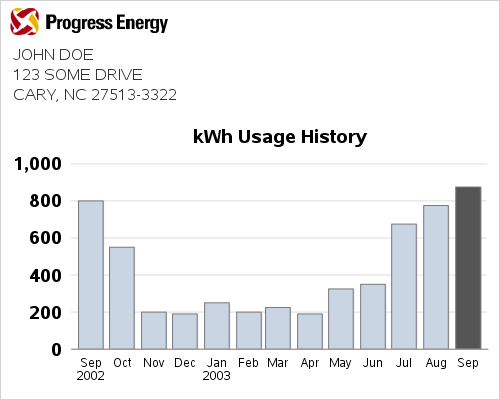
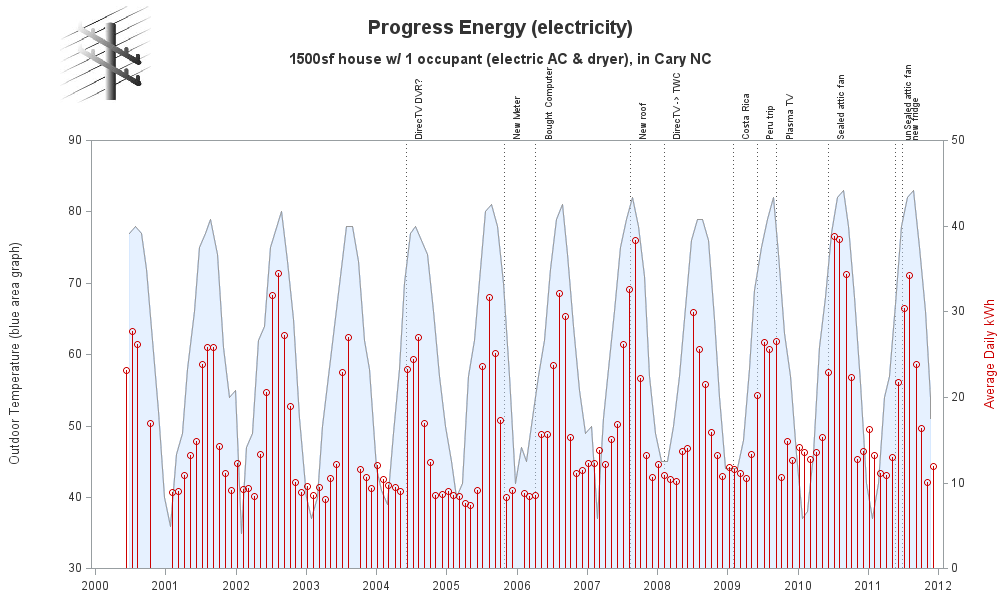
Power Bill Graph
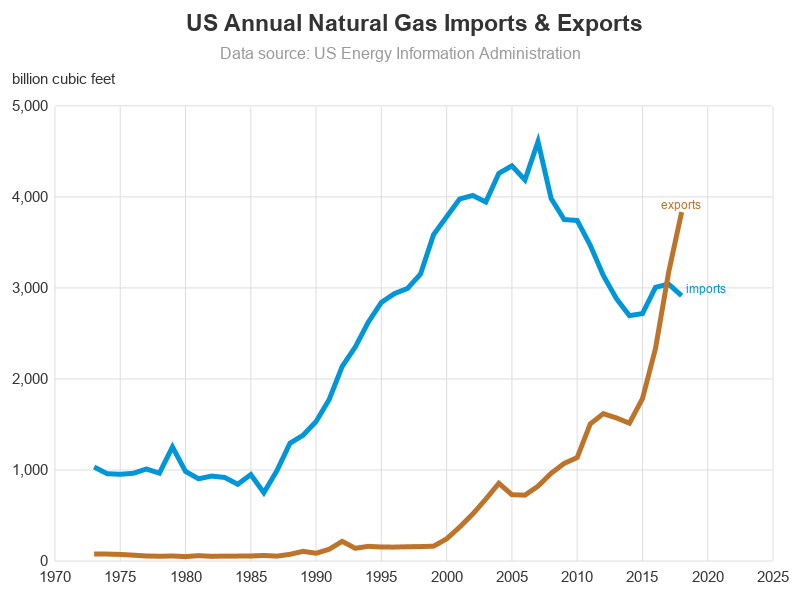
Natural Gas Exports
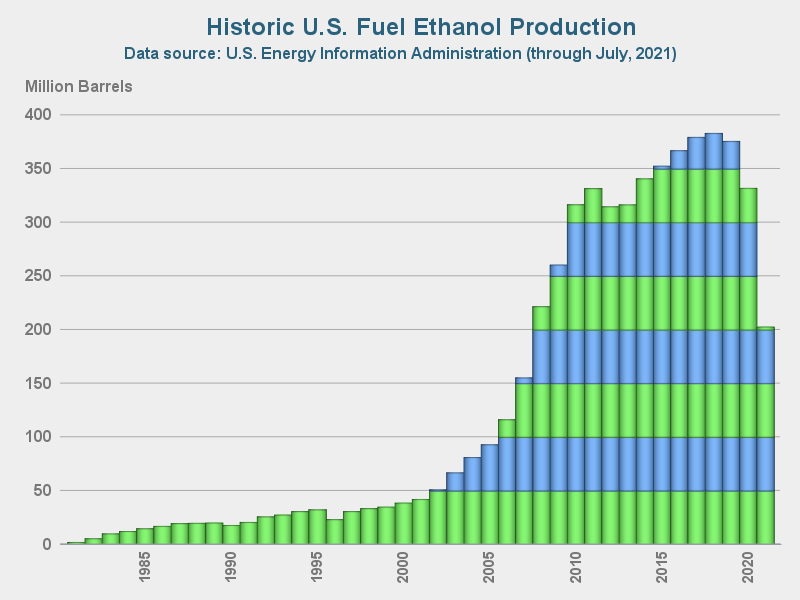
Ethanol Production
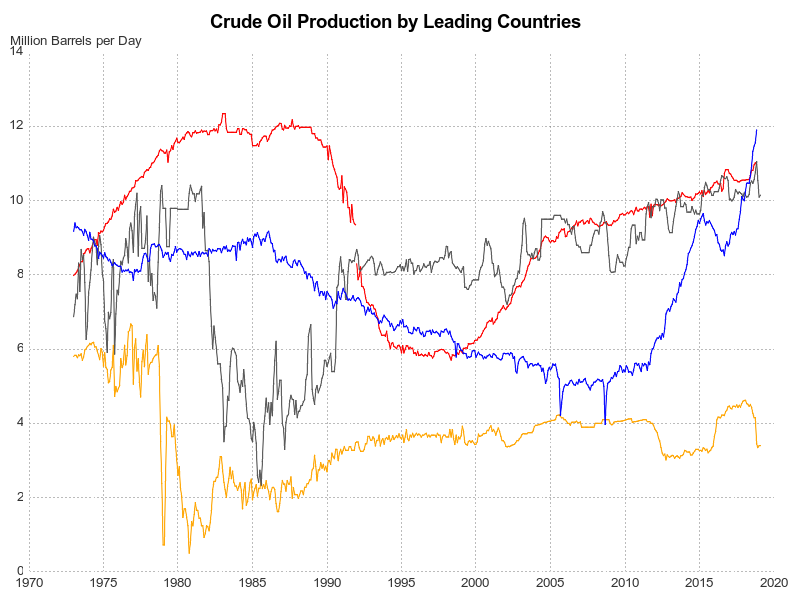
Oil Production Plot
![]()
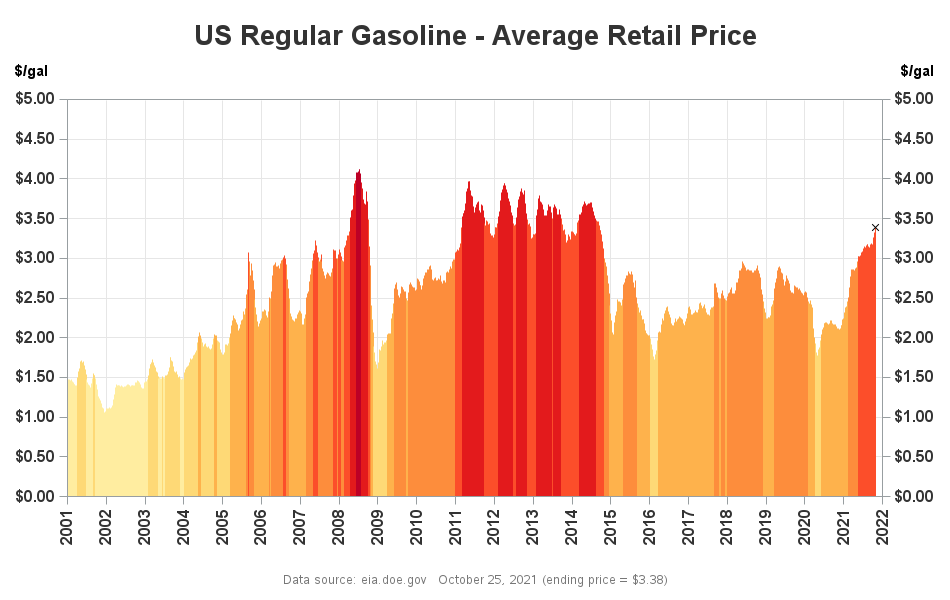
Gasoline Prices Graph
Nuclear Accident Map
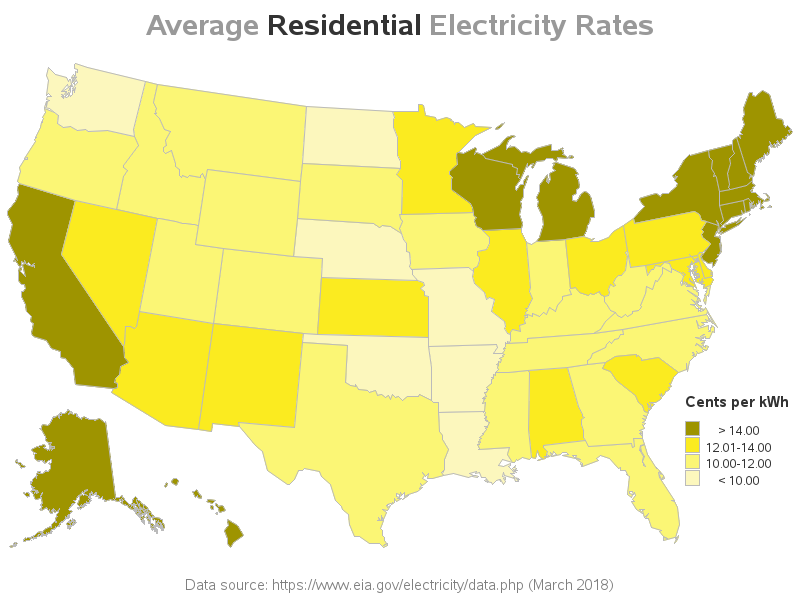
State Electric Prices
Electricity Usage
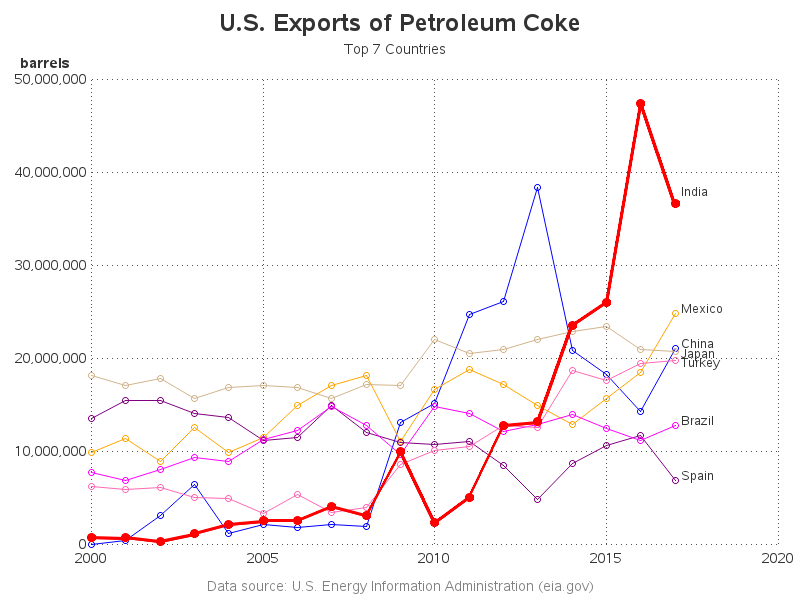

US Petcoke Exports
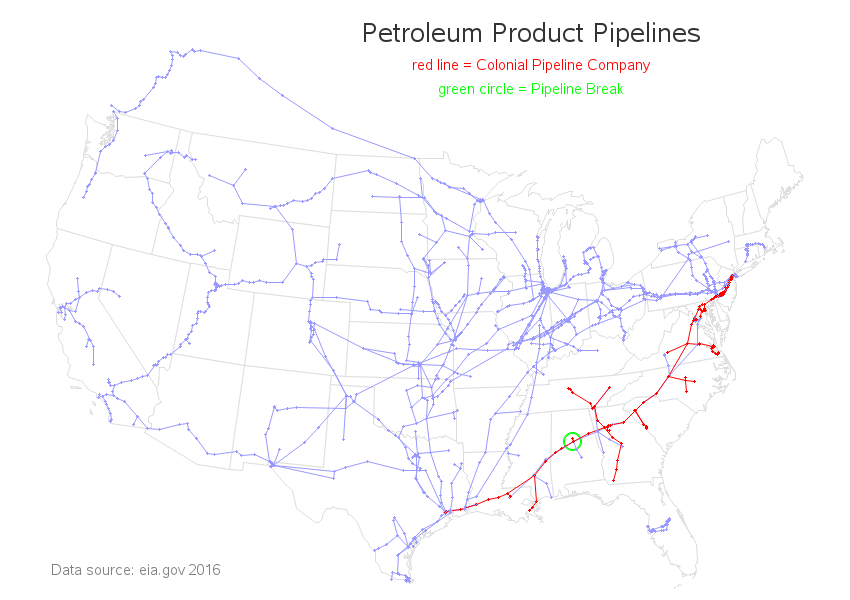
US Pipeline Break
Electricity Generation
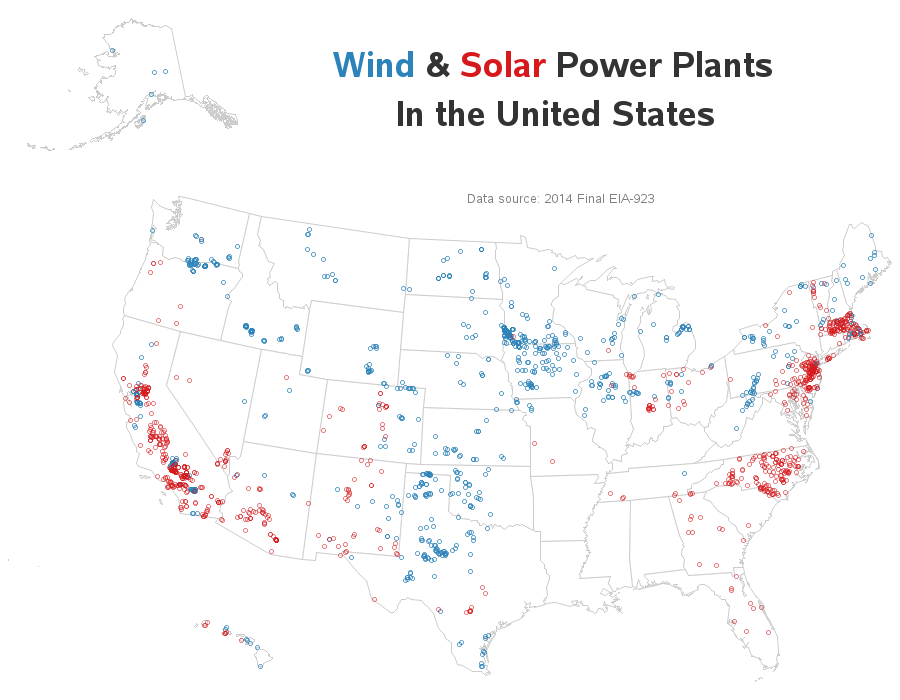
US Green Energy
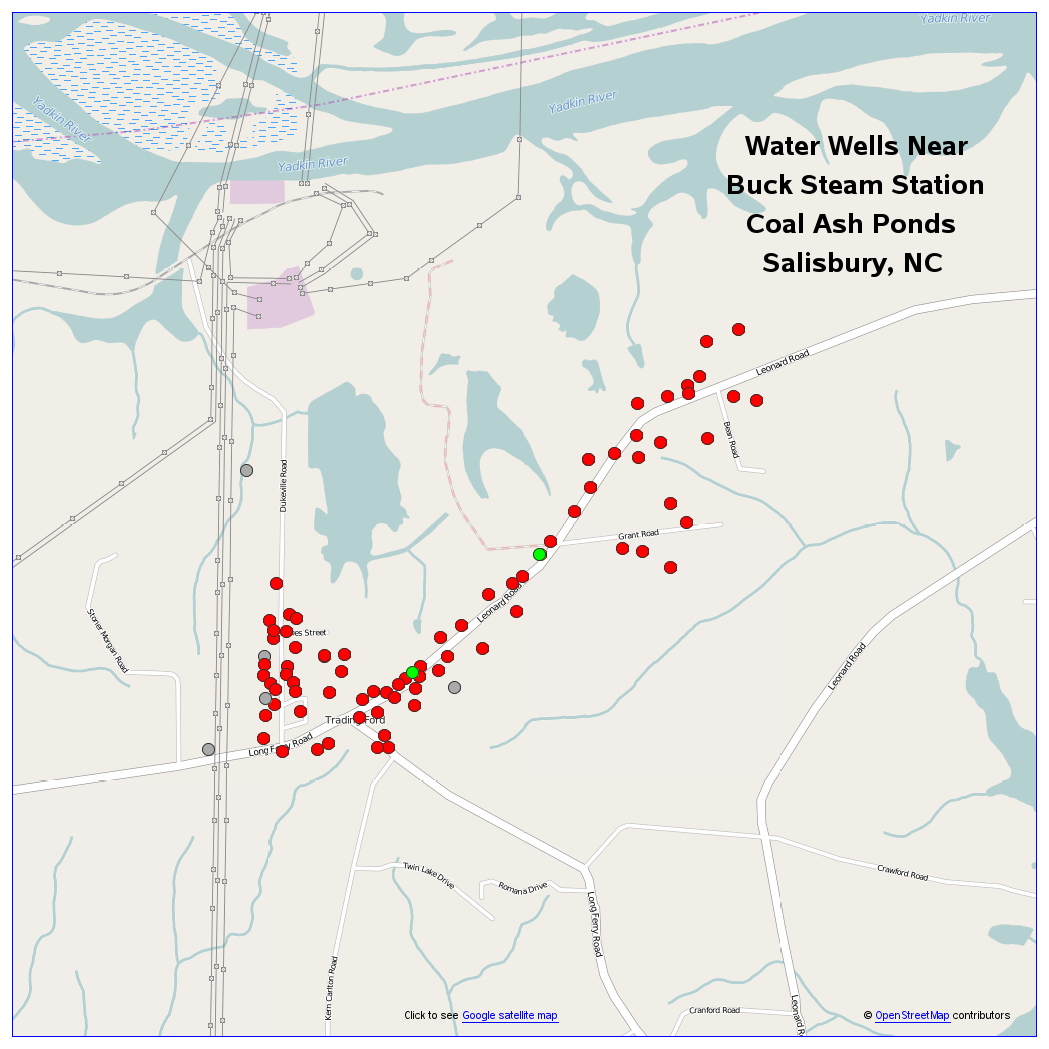
Coal Ash and Wells
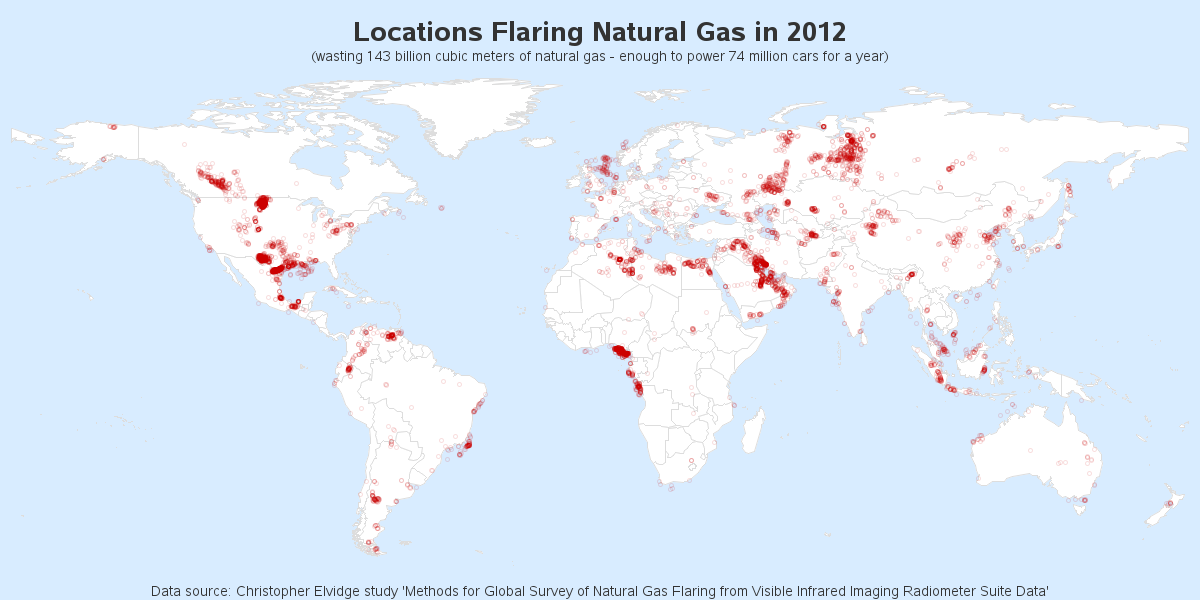
Natural Gas Flaring
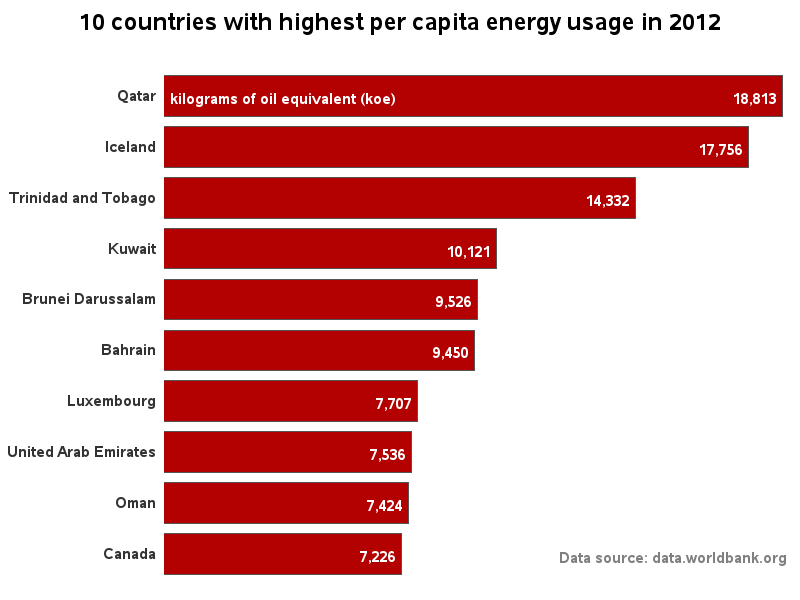
Energy Consumption
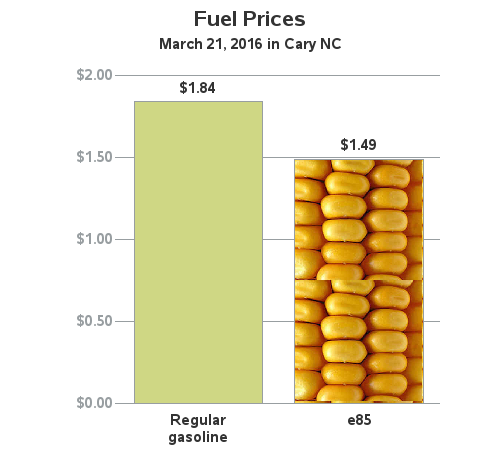
Gasoline -vs- E85
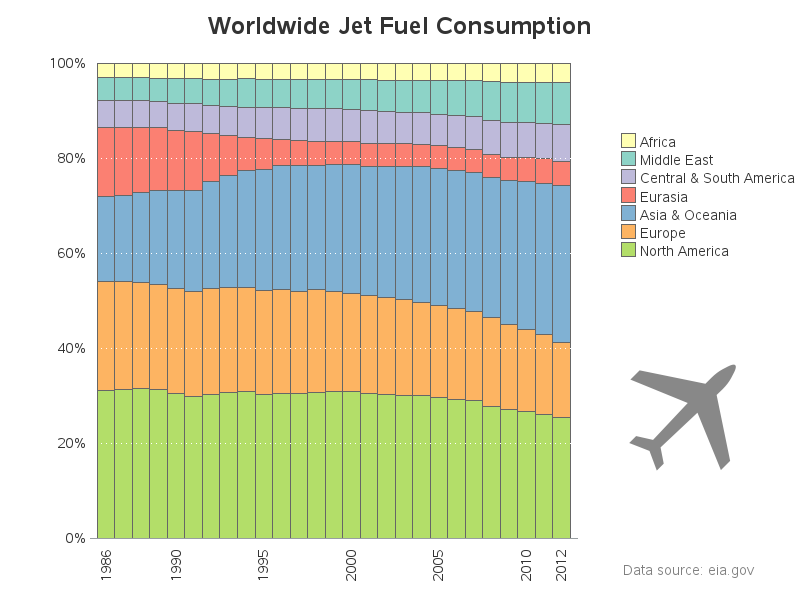
Jet Fuel Consumption
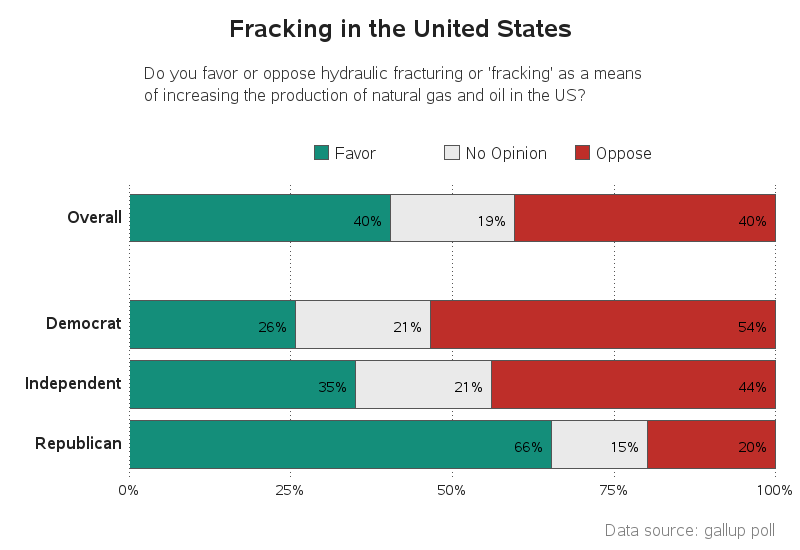
Fracking Opinion
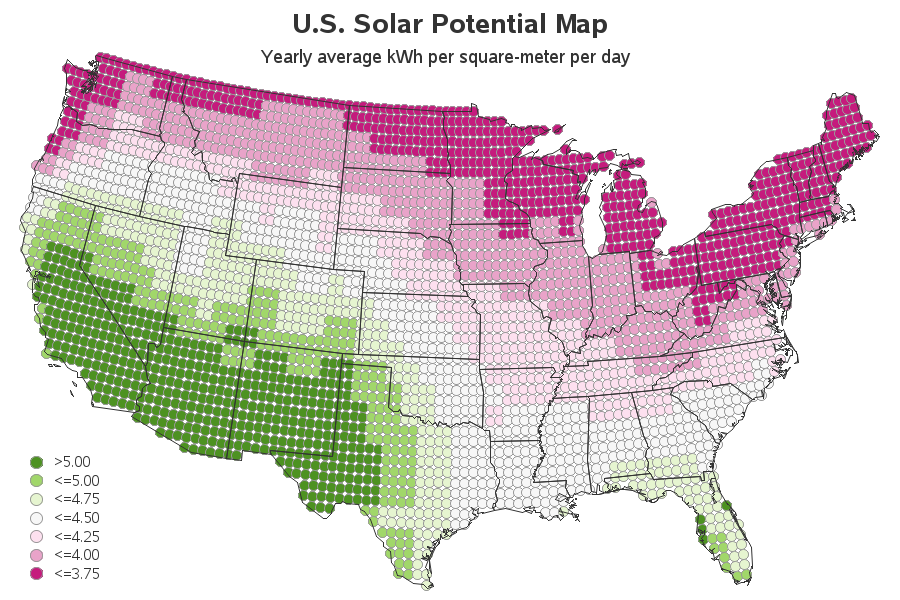
Solar Potential Map
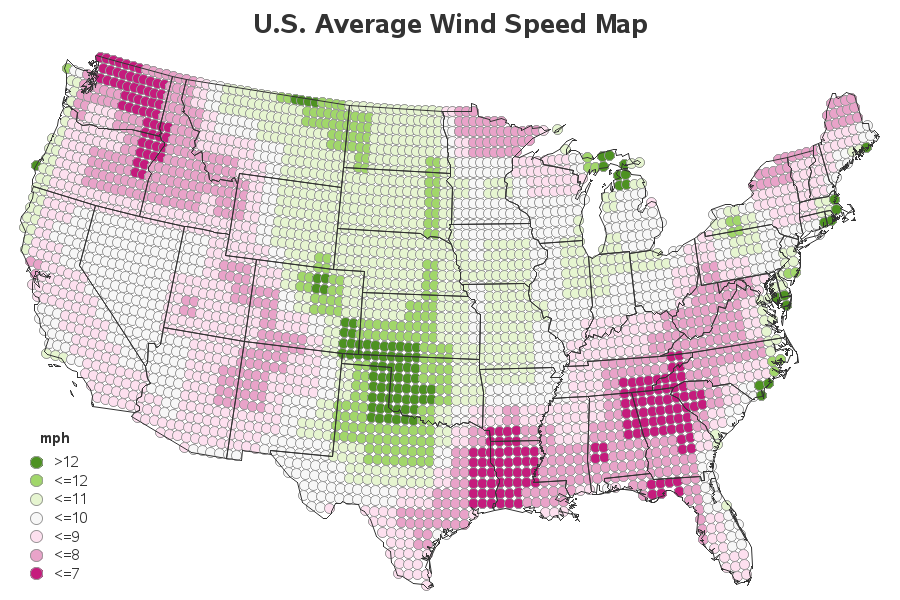
Wind Potential Map
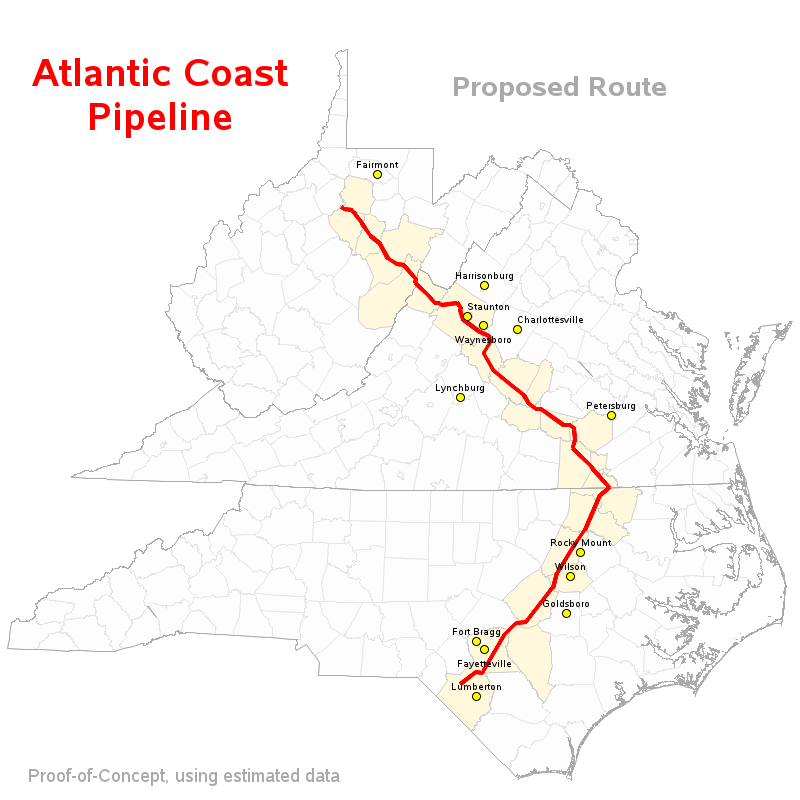
Atlantic Coast Pipeline
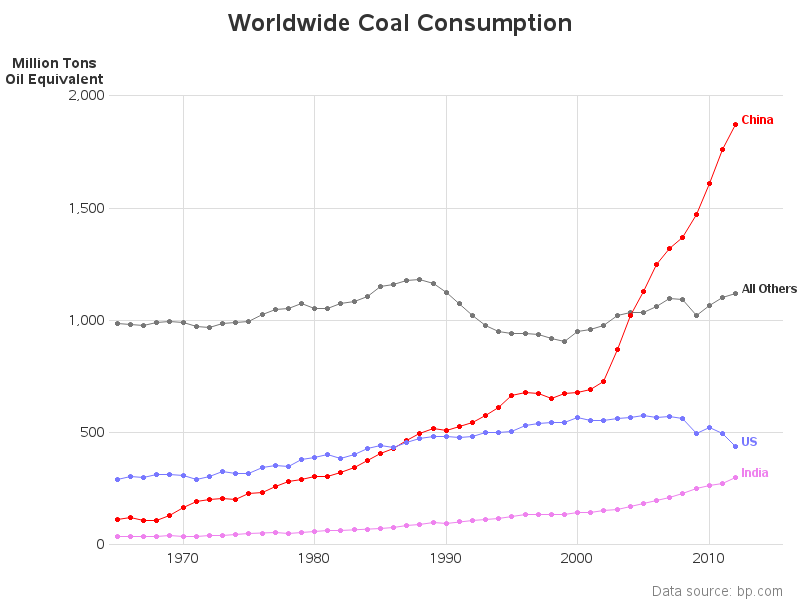
Coal Consumption
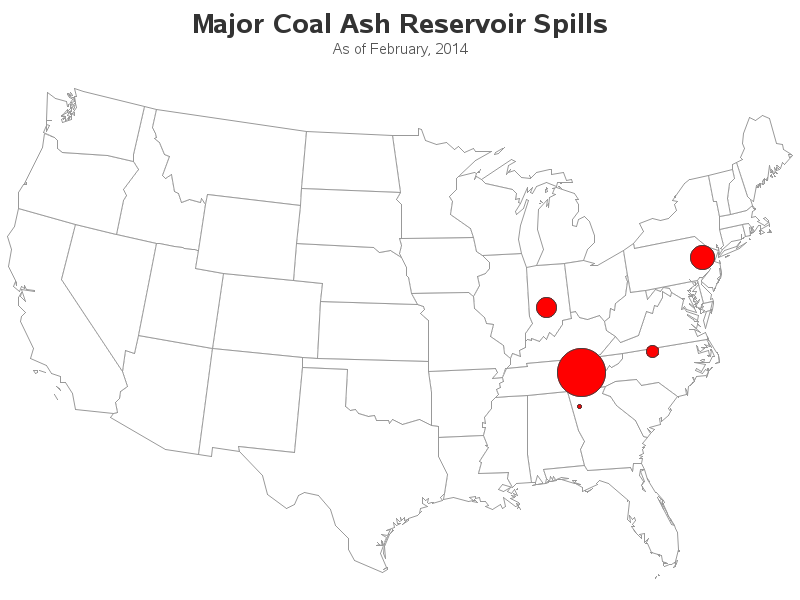
Coal Ash Spills
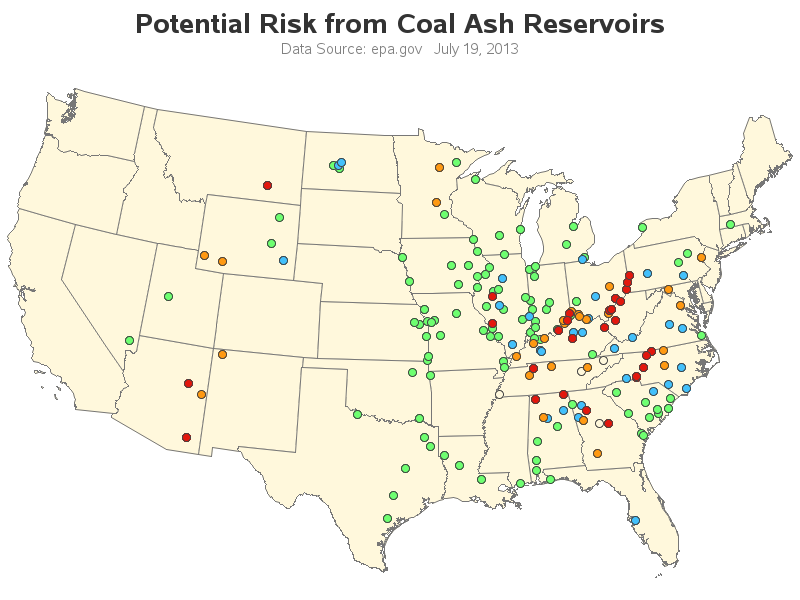
Coal Ash Reservoirs
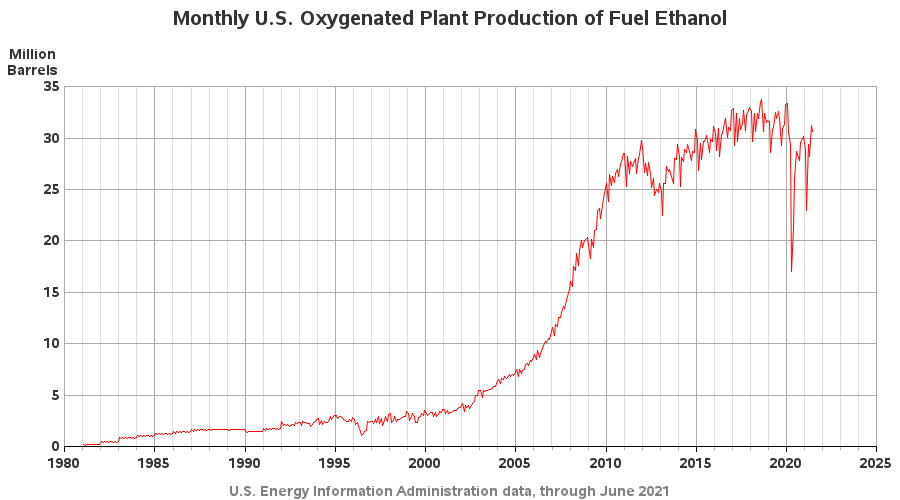
US Fuel Ethanol
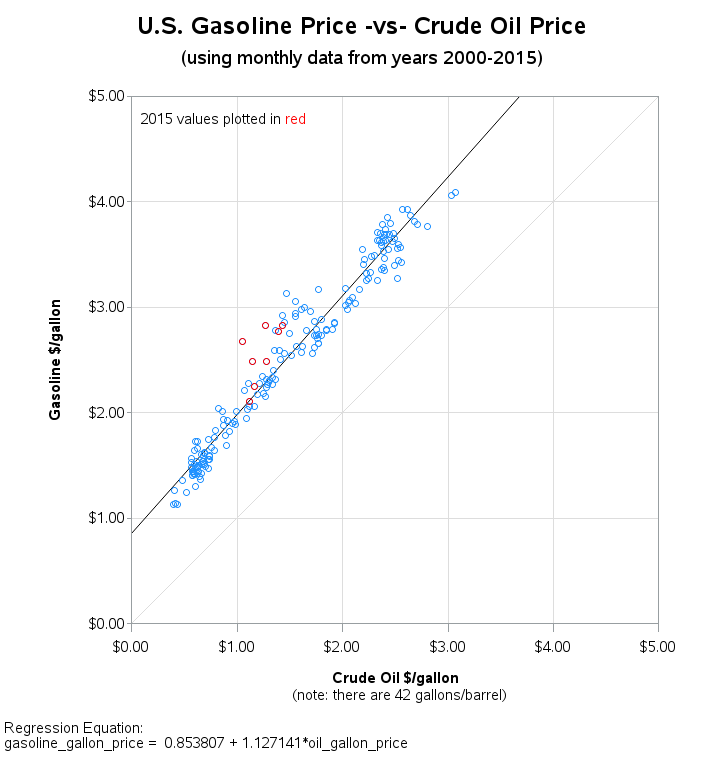
Oil/Gasoline Correlation
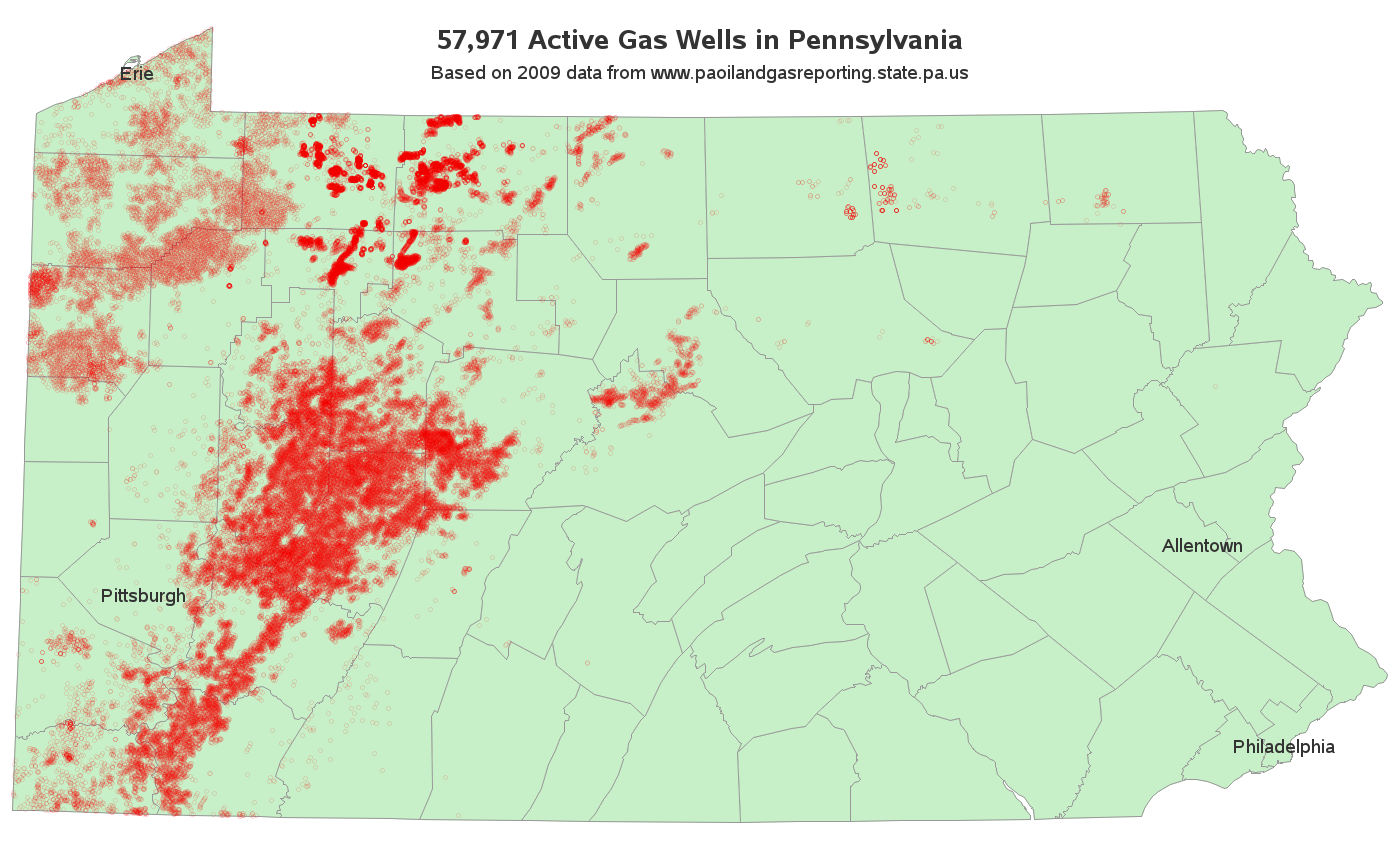
PA Active Gas Wells
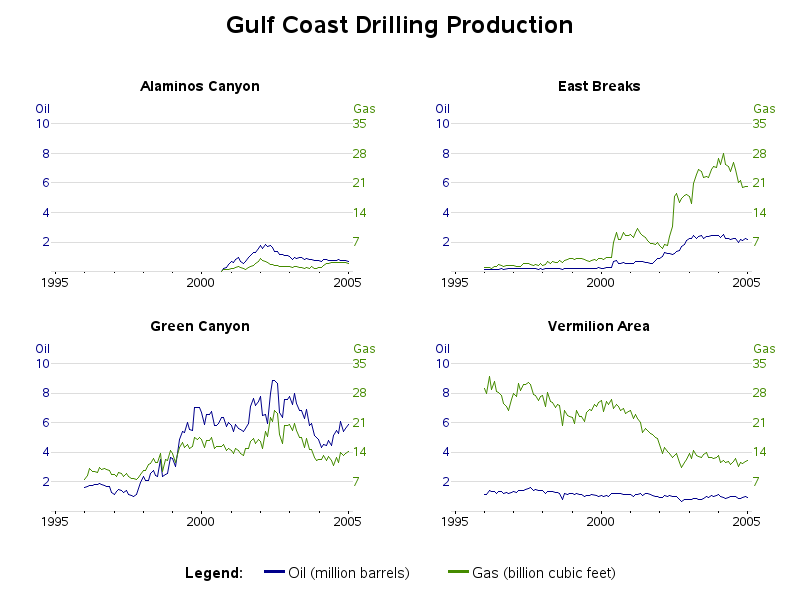
Gulf Coast Drilling
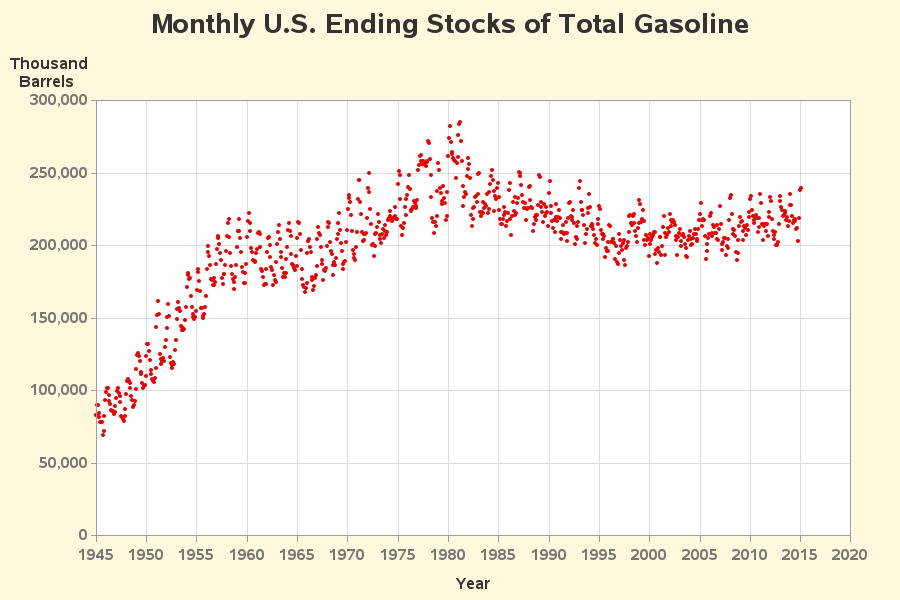
US Gasoline Stockpile
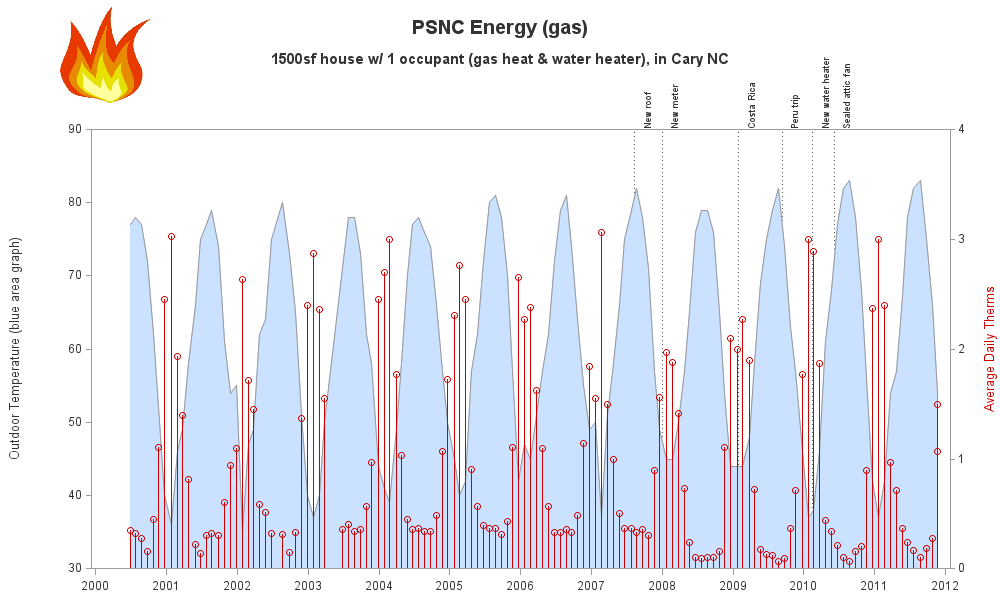
Monthly Gas Usage
Oil Spills Map
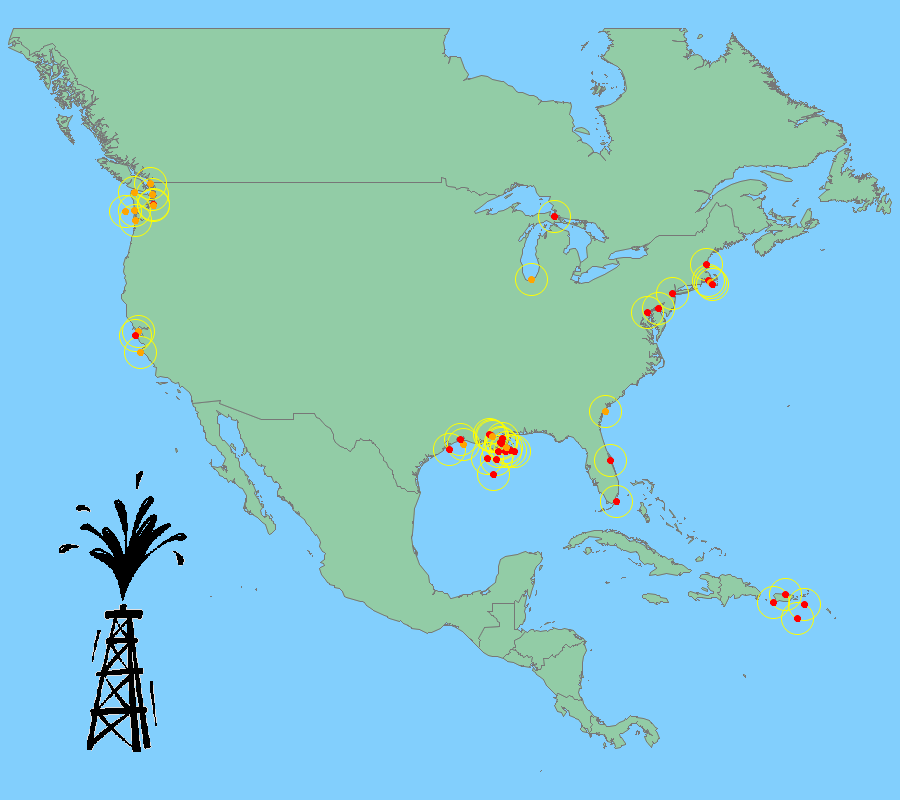
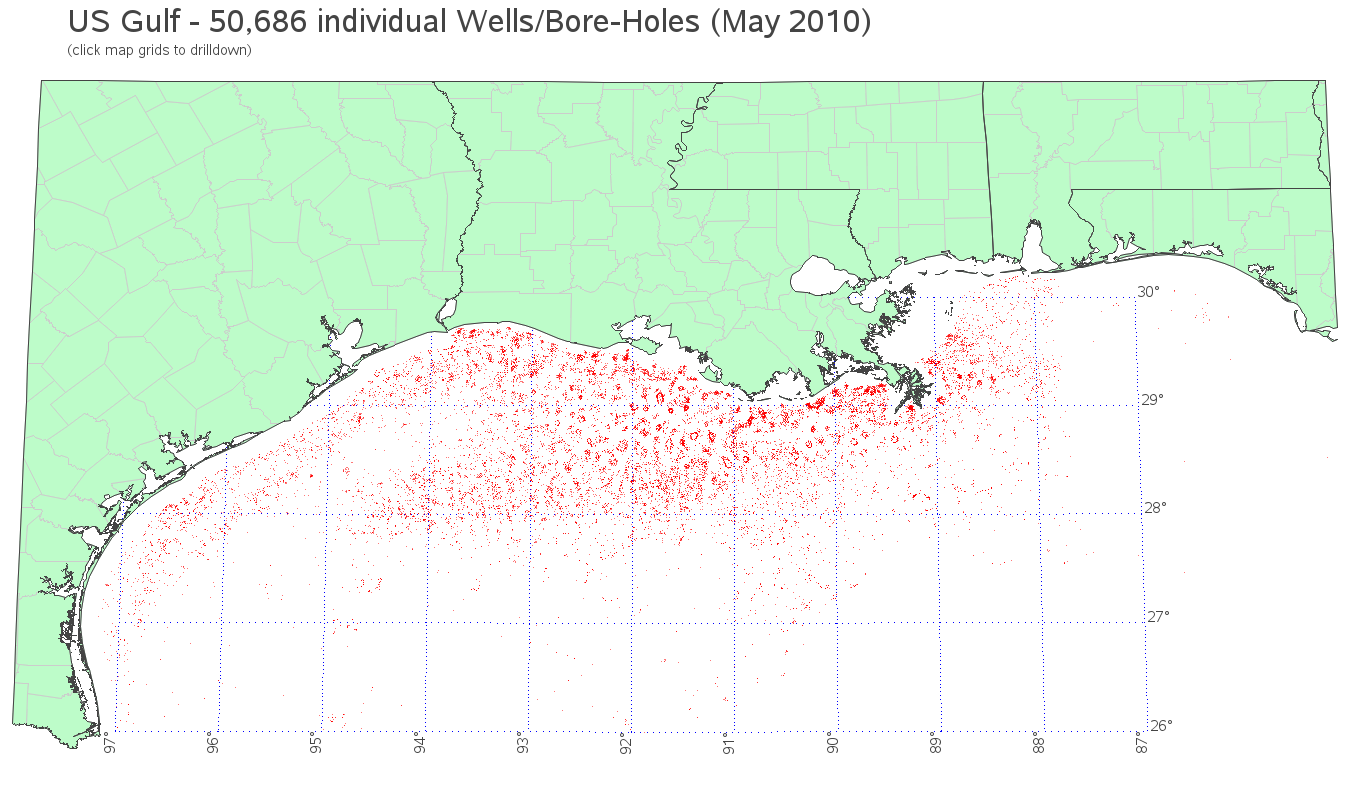
Gulf Coast Boreholes

![]()
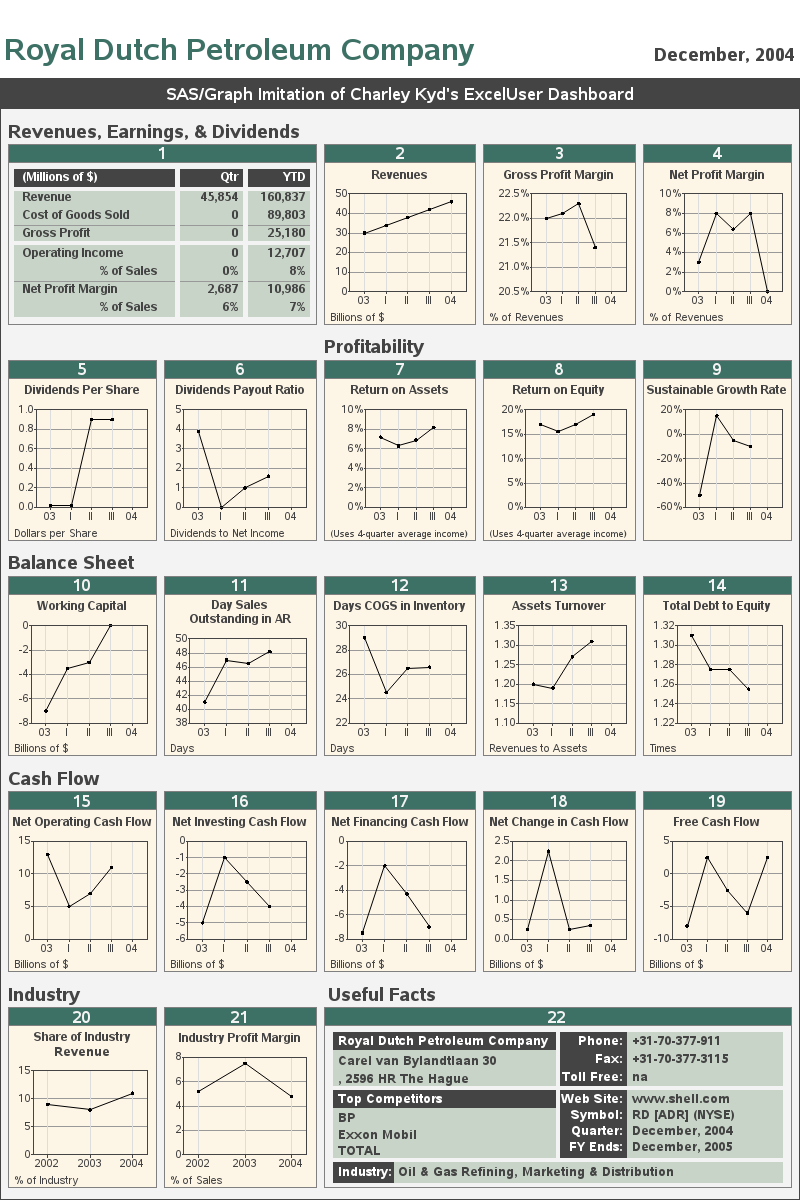
Royal Dutch Petroleum
OPEC Oil Analysis
Nuclear Plant Locations
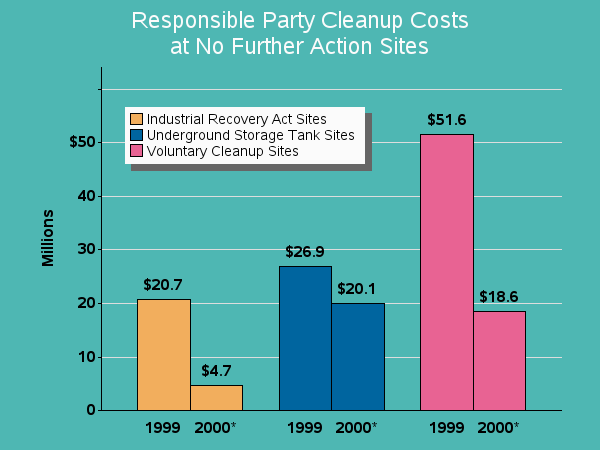
Tank Cleanup Costs
These samples courtesy of Robert Allison
Please see the following README