County = Wilson
Cases reported = 13,237
Population = 81,801
% of population reported positive = 16.2% County = Surry
Cases reported = 12,425
Population = 71,783
% of population reported positive = 17.3% County = Stanly
Cases reported = 11,652
Population = 62,806
% of population reported positive = 18.6% County = Scotland
Cases reported = 5,735
Population = 34,823
% of population reported positive = 16.5% County = Sampson
Cases reported = 11,296
Population = 63,531
% of population reported positive = 17.8% County = Rutherford
Cases reported = 11,433
Population = 67,029
% of population reported positive = 17.1% County = Rowan
Cases reported = 26,221
Population = 142,088
% of population reported positive = 18.5% County = Robeson
Cases reported = 24,992
Population = 130,625
% of population reported positive = 19.1% County = Pitt
Cases reported = 29,706
Population = 180,742
% of population reported positive = 16.4% County = Nash
Cases reported = 15,256
Population = 94,298
% of population reported positive = 16.2% County = Montgomery
Cases reported = 4,542
Population = 27,173
% of population reported positive = 16.7% County = Martin
Cases reported = 3,651
Population = 22,440
% of population reported positive = 16.3% County = McDowell
Cases reported = 8,647
Population = 45,756
% of population reported positive = 18.9% County = Lincoln
Cases reported = 14,999
Population = 86,111
% of population reported positive = 17.4% County = Lenoir
Cases reported = 9,483
Population = 55,949
% of population reported positive = 16.9% County = Hyde
Cases reported = 826
Population = 4,937
% of population reported positive = 16.7% County = Hyde
Cases reported = 826
Population = 4,937
% of population reported positive = 16.7% County = Hyde
Cases reported = 826
Population = 4,937
% of population reported positive = 16.7% County = Hyde
Cases reported = 826
Population = 4,937
% of population reported positive = 16.7% County = Hyde
Cases reported = 826
Population = 4,937
% of population reported positive = 16.7% County = Hyde
Cases reported = 826
Population = 4,937
% of population reported positive = 16.7% County = Hyde
Cases reported = 826
Population = 4,937
% of population reported positive = 16.7% County = Hyde
Cases reported = 826
Population = 4,937
% of population reported positive = 16.7% County = Hyde
Cases reported = 826
Population = 4,937
% of population reported positive = 16.7% County = Gaston
Cases reported = 40,027
Population = 224,529
% of population reported positive = 17.8% County = Duplin
Cases reported = 9,972
Population = 58,741
% of population reported positive = 17.0% County = Columbus
Cases reported = 10,086
Population = 55,508
% of population reported positive = 18.2% County = Cleveland
Cases reported = 18,367
Population = 97,947
% of population reported positive = 18.8% County = Chowan
Cases reported = 2,297
Population = 13,943
% of population reported positive = 16.5% County = Chowan
Cases reported = 2,297
Population = 13,943
% of population reported positive = 16.5% County = Cherokee
Cases reported = 4,643
Population = 28,612
% of population reported positive = 16.2% County = Catawba
Cases reported = 28,347
Population = 159,551
% of population reported positive = 17.8% County = Caldwell
Cases reported = 13,418
Population = 82,178
% of population reported positive = 16.3% County = Burke
Cases reported = 15,745
Population = 90,485
% of population reported positive = 17.4% County = Bladen
Cases reported = 5,476
Population = 32,722
% of population reported positive = 16.7% County = Alexander
Cases reported = 6,469
Population = 37,497
% of population reported positive = 17.3% County = Yancey
Cases reported = 2,823
Population = 18,069
% of population reported positive = 15.6% County = Yadkin
Cases reported = 6,005
Population = 37,667
% of population reported positive = 15.9% County = Wilkes
Cases reported = 10,570
Population = 68,412
% of population reported positive = 15.5% County = Vance
Cases reported = 6,838
Population = 44,535
% of population reported positive = 15.4% County = Union
Cases reported = 36,383
Population = 239,859
% of population reported positive = 15.2% County = Richmond
Cases reported = 7,125
Population = 44,829
% of population reported positive = 15.9% County = Randolph
Cases reported = 21,865
Population = 143,667
% of population reported positive = 15.2% County = Lee
Cases reported = 9,434
Population = 61,779
% of population reported positive = 15.3% County = Johnston
Cases reported = 32,416
Population = 209,339
% of population reported positive = 15.5% County = Iredell
Cases reported = 28,885
Population = 181,806
% of population reported positive = 15.9% County = Halifax
Cases reported = 7,918
Population = 50,010
% of population reported positive = 15.8% County = Greene
Cases reported = 3,318
Population = 21,069
% of population reported positive = 15.7% County = Graham
Cases reported = 1,330
Population = 8,441
% of population reported positive = 15.8% County = Edgecombe
Cases reported = 7,949
Population = 51,472
% of population reported positive = 15.4% County = Davidson
Cases reported = 25,786
Population = 167,609
% of population reported positive = 15.4% County = Cabarrus
Cases reported = 32,853
Population = 216,453
% of population reported positive = 15.2% County = Beaufort
Cases reported = 7,179
Population = 46,994
% of population reported positive = 15.3% County = Beaufort
Cases reported = 7,179
Population = 46,994
% of population reported positive = 15.3% County = Beaufort
Cases reported = 7,179
Population = 46,994
% of population reported positive = 15.3% County = Avery
Cases reported = 2,735
Population = 17,557
% of population reported positive = 15.6% County = Anson
Cases reported = 3,856
Population = 24,446
% of population reported positive = 15.8% County = Alamance
Cases reported = 26,393
Population = 169,509
% of population reported positive = 15.6% County = Onslow
Cases reported = 29,587
Population = 197,938
% of population reported positive = 14.9% County = Onslow
Cases reported = 29,587
Population = 197,938
% of population reported positive = 14.9% County = Onslow
Cases reported = 29,587
Population = 197,938
% of population reported positive = 14.9% County = Onslow
Cases reported = 29,587
Population = 197,938
% of population reported positive = 14.9% County = Onslow
Cases reported = 29,587
Population = 197,938
% of population reported positive = 14.9% County = Onslow
Cases reported = 29,587
Population = 197,938
% of population reported positive = 14.9% County = Onslow
Cases reported = 29,587
Population = 197,938
% of population reported positive = 14.9% County = Onslow
Cases reported = 29,587
Population = 197,938
% of population reported positive = 14.9% County = Onslow
Cases reported = 29,587
Population = 197,938
% of population reported positive = 14.9% County = Onslow
Cases reported = 29,587
Population = 197,938
% of population reported positive = 14.9% County = Onslow
Cases reported = 29,587
Population = 197,938
% of population reported positive = 14.9% County = Onslow
Cases reported = 29,587
Population = 197,938
% of population reported positive = 14.9% County = Onslow
Cases reported = 29,587
Population = 197,938
% of population reported positive = 14.9% County = Onslow
Cases reported = 29,587
Population = 197,938
% of population reported positive = 14.9% County = Onslow
Cases reported = 29,587
Population = 197,938
% of population reported positive = 14.9% County = Onslow
Cases reported = 29,587
Population = 197,938
% of population reported positive = 14.9% County = Onslow
Cases reported = 29,587
Population = 197,938
% of population reported positive = 14.9% County = Onslow
Cases reported = 29,587
Population = 197,938
% of population reported positive = 14.9% County = Mecklenburg
Cases reported = 157,260
Population = 1,110,356
% of population reported positive = 14.2% County = Jones
Cases reported = 1,351
Population = 9,419
% of population reported positive = 14.3% County = Franklin
Cases reported = 9,907
Population = 69,685
% of population reported positive = 14.2% County = Davie
Cases reported = 6,435
Population = 42,846
% of population reported positive = 15.0% County = Clay
Cases reported = 1,656
Population = 11,231
% of population reported positive = 14.7% County = Caswell
Cases reported = 3,195
Population = 22,604
% of population reported positive = 14.1% County = Alleghany
Cases reported = 1,614
Population = 11,137
% of population reported positive = 14.5% County = Wayne
Cases reported = 16,447
Population = 123,131
% of population reported positive = 13.4% County = Washington
Cases reported = 1,593
Population = 11,580
% of population reported positive = 13.8% County = Tyrrell
Cases reported = 552
Population = 4,016
% of population reported positive = 13.7% County = Tyrrell
Cases reported = 552
Population = 4,016
% of population reported positive = 13.7% County = Swain
Cases reported = 1,972
Population = 14,271
% of population reported positive = 13.8% County = Stokes
Cases reported = 6,257
Population = 45,591
% of population reported positive = 13.7% County = Rockingham
Cases reported = 12,184
Population = 91,010
% of population reported positive = 13.4% County = Pender
Cases reported = 8,805
Population = 63,060
% of population reported positive = 14.0% County = Pender
Cases reported = 8,805
Population = 63,060
% of population reported positive = 14.0% County = Pender
Cases reported = 8,805
Population = 63,060
% of population reported positive = 14.0% County = Pender
Cases reported = 8,805
Population = 63,060
% of population reported positive = 14.0% County = Pender
Cases reported = 8,805
Population = 63,060
% of population reported positive = 14.0% County = Pender
Cases reported = 8,805
Population = 63,060
% of population reported positive = 14.0% County = Pender
Cases reported = 8,805
Population = 63,060
% of population reported positive = 14.0% County = Pender
Cases reported = 8,805
Population = 63,060
% of population reported positive = 14.0% County = Pender
Cases reported = 8,805
Population = 63,060
% of population reported positive = 14.0% County = Pender
Cases reported = 8,805
Population = 63,060
% of population reported positive = 14.0% County = Pender
Cases reported = 8,805
Population = 63,060
% of population reported positive = 14.0% County = Pender
Cases reported = 8,805
Population = 63,060
% of population reported positive = 14.0% County = Pender
Cases reported = 8,805
Population = 63,060
% of population reported positive = 14.0% County = Pender
Cases reported = 8,805
Population = 63,060
% of population reported positive = 14.0% County = Pender
Cases reported = 8,805
Population = 63,060
% of population reported positive = 14.0% County = Pender
Cases reported = 8,805
Population = 63,060
% of population reported positive = 14.0% County = Pender
Cases reported = 8,805
Population = 63,060
% of population reported positive = 14.0% County = Pender
Cases reported = 8,805
Population = 63,060
% of population reported positive = 14.0% County = Pender
Cases reported = 8,805
Population = 63,060
% of population reported positive = 14.0% County = Pender
Cases reported = 8,805
Population = 63,060
% of population reported positive = 14.0% County = Pender
Cases reported = 8,805
Population = 63,060
% of population reported positive = 14.0% County = Pender
Cases reported = 8,805
Population = 63,060
% of population reported positive = 14.0% County = Pender
Cases reported = 8,805
Population = 63,060
% of population reported positive = 14.0% County = Pasquotank
Cases reported = 5,249
Population = 39,824
% of population reported positive = 13.2% County = Pamlico
Cases reported = 1,719
Population = 12,726
% of population reported positive = 13.5% County = Northampton
Cases reported = 2,599
Population = 19,483
% of population reported positive = 13.3% County = Moore
Cases reported = 13,666
Population = 100,880
% of population reported positive = 13.5% County = Mitchell
Cases reported = 2,057
Population = 14,964
% of population reported positive = 13.7% County = Macon
Cases reported = 4,970
Population = 35,858
% of population reported positive = 13.9% County = Harnett
Cases reported = 18,470
Population = 135,976
% of population reported positive = 13.6% County = Granville
Cases reported = 7,952
Population = 60,443
% of population reported positive = 13.2% County = Forsyth
Cases reported = 51,785
Population = 382,295
% of population reported positive = 13.5% County = Cumberland
Cases reported = 45,623
Population = 335,509
% of population reported positive = 13.6% County = Craven
Cases reported = 14,286
Population = 102,139
% of population reported positive = 14.0% County = Craven
Cases reported = 14,286
Population = 102,139
% of population reported positive = 14.0% County = Craven
Cases reported = 14,286
Population = 102,139
% of population reported positive = 14.0% County = Bertie
Cases reported = 2,475
Population = 18,947
% of population reported positive = 13.1% County = Bertie
Cases reported = 2,475
Population = 18,947
% of population reported positive = 13.1% County = Watauga
Cases reported = 6,636
Population = 56,177
% of population reported positive = 11.8% County = Warren
Cases reported = 2,388
Population = 19,731
% of population reported positive = 12.1% County = Wake
Cases reported = 129,210
Population = 1,111,761
% of population reported positive = 11.6% County = Transylvania
Cases reported = 3,888
Population = 34,385
% of population reported positive = 11.3% County = Polk
Cases reported = 2,335
Population = 20,724
% of population reported positive = 11.3% County = Person
Cases reported = 5,105
Population = 39,490
% of population reported positive = 12.9% County = Perquimans
Cases reported = 1,558
Population = 13,463
% of population reported positive = 11.6% County = Orange
Cases reported = 11,838
Population = 148,476
% of population reported positive = 8.0% County = New Hanover
Cases reported = 28,699
Population = 234,473
% of population reported positive = 12.2% County = New Hanover
Cases reported = 28,699
Population = 234,473
% of population reported positive = 12.2% County = New Hanover
Cases reported = 28,699
Population = 234,473
% of population reported positive = 12.2% County = New Hanover
Cases reported = 28,699
Population = 234,473
% of population reported positive = 12.2% County = New Hanover
Cases reported = 28,699
Population = 234,473
% of population reported positive = 12.2% County = New Hanover
Cases reported = 28,699
Population = 234,473
% of population reported positive = 12.2% County = New Hanover
Cases reported = 28,699
Population = 234,473
% of population reported positive = 12.2% County = New Hanover
Cases reported = 28,699
Population = 234,473
% of population reported positive = 12.2% County = New Hanover
Cases reported = 28,699
Population = 234,473
% of population reported positive = 12.2% County = New Hanover
Cases reported = 28,699
Population = 234,473
% of population reported positive = 12.2% County = New Hanover
Cases reported = 28,699
Population = 234,473
% of population reported positive = 12.2% County = New Hanover
Cases reported = 28,699
Population = 234,473
% of population reported positive = 12.2% County = New Hanover
Cases reported = 28,699
Population = 234,473
% of population reported positive = 12.2% County = New Hanover
Cases reported = 28,699
Population = 234,473
% of population reported positive = 12.2% County = New Hanover
Cases reported = 28,699
Population = 234,473
% of population reported positive = 12.2% County = New Hanover
Cases reported = 28,699
Population = 234,473
% of population reported positive = 12.2% County = New Hanover
Cases reported = 28,699
Population = 234,473
% of population reported positive = 12.2% County = New Hanover
Cases reported = 28,699
Population = 234,473
% of population reported positive = 12.2% County = New Hanover
Cases reported = 28,699
Population = 234,473
% of population reported positive = 12.2% County = New Hanover
Cases reported = 28,699
Population = 234,473
% of population reported positive = 12.2% County = Madison
Cases reported = 2,781
Population = 21,755
% of population reported positive = 12.8% County = Jackson
Cases reported = 5,652
Population = 43,938
% of population reported positive = 12.9% County = Hoke
Cases reported = 7,143
Population = 55,234
% of population reported positive = 12.9% County = Hertford
Cases reported = 2,856
Population = 23,677
% of population reported positive = 12.1% County = Henderson
Cases reported = 15,230
Population = 117,417
% of population reported positive = 13.0% County = Haywood
Cases reported = 7,464
Population = 62,317
% of population reported positive = 12.0% County = Guilford
Cases reported = 67,913
Population = 537,174
% of population reported positive = 12.6% County = Gates
Cases reported = 1,088
Population = 11,562
% of population reported positive = 9.4% County = Durham
Cases reported = 34,630
Population = 321,488
% of population reported positive = 10.8% County = Dare
Cases reported = 3,850
Population = 37,009
% of population reported positive = 10.4% County = Dare
Cases reported = 3,850
Population = 37,009
% of population reported positive = 10.4% County = Dare
Cases reported = 3,850
Population = 37,009
% of population reported positive = 10.4% County = Dare
Cases reported = 3,850
Population = 37,009
% of population reported positive = 10.4% County = Dare
Cases reported = 3,850
Population = 37,009
% of population reported positive = 10.4% County = Dare
Cases reported = 3,850
Population = 37,009
% of population reported positive = 10.4% County = Dare
Cases reported = 3,850
Population = 37,009
% of population reported positive = 10.4% County = Dare
Cases reported = 3,850
Population = 37,009
% of population reported positive = 10.4% County = Dare
Cases reported = 3,850
Population = 37,009
% of population reported positive = 10.4% County = Dare
Cases reported = 3,850
Population = 37,009
% of population reported positive = 10.4% County = Dare
Cases reported = 3,850
Population = 37,009
% of population reported positive = 10.4% County = Dare
Cases reported = 3,850
Population = 37,009
% of population reported positive = 10.4% County = Dare
Cases reported = 3,850
Population = 37,009
% of population reported positive = 10.4% County = Dare
Cases reported = 3,850
Population = 37,009
% of population reported positive = 10.4% County = Dare
Cases reported = 3,850
Population = 37,009
% of population reported positive = 10.4% County = Dare
Cases reported = 3,850
Population = 37,009
% of population reported positive = 10.4% County = Dare
Cases reported = 3,850
Population = 37,009
% of population reported positive = 10.4% County = Dare
Cases reported = 3,850
Population = 37,009
% of population reported positive = 10.4% County = Dare
Cases reported = 3,850
Population = 37,009
% of population reported positive = 10.4% County = Dare
Cases reported = 3,850
Population = 37,009
% of population reported positive = 10.4% County = Dare
Cases reported = 3,850
Population = 37,009
% of population reported positive = 10.4% County = Dare
Cases reported = 3,850
Population = 37,009
% of population reported positive = 10.4% County = Dare
Cases reported = 3,850
Population = 37,009
% of population reported positive = 10.4% County = Dare
Cases reported = 3,850
Population = 37,009
% of population reported positive = 10.4% County = Dare
Cases reported = 3,850
Population = 37,009
% of population reported positive = 10.4% County = Dare
Cases reported = 3,850
Population = 37,009
% of population reported positive = 10.4% County = Dare
Cases reported = 3,850
Population = 37,009
% of population reported positive = 10.4% County = Dare
Cases reported = 3,850
Population = 37,009
% of population reported positive = 10.4% County = Dare
Cases reported = 3,850
Population = 37,009
% of population reported positive = 10.4% County = Dare
Cases reported = 3,850
Population = 37,009
% of population reported positive = 10.4% County = Dare
Cases reported = 3,850
Population = 37,009
% of population reported positive = 10.4% County = Dare
Cases reported = 3,850
Population = 37,009
% of population reported positive = 10.4% County = Dare
Cases reported = 3,850
Population = 37,009
% of population reported positive = 10.4% County = Dare
Cases reported = 3,850
Population = 37,009
% of population reported positive = 10.4% County = Dare
Cases reported = 3,850
Population = 37,009
% of population reported positive = 10.4% County = Dare
Cases reported = 3,850
Population = 37,009
% of population reported positive = 10.4% County = Dare
Cases reported = 3,850
Population = 37,009
% of population reported positive = 10.4% County = Dare
Cases reported = 3,850
Population = 37,009
% of population reported positive = 10.4% County = Dare
Cases reported = 3,850
Population = 37,009
% of population reported positive = 10.4% County = Dare
Cases reported = 3,850
Population = 37,009
% of population reported positive = 10.4% County = Dare
Cases reported = 3,850
Population = 37,009
% of population reported positive = 10.4% County = Dare
Cases reported = 3,850
Population = 37,009
% of population reported positive = 10.4% County = Dare
Cases reported = 3,850
Population = 37,009
% of population reported positive = 10.4% County = Currituck
Cases reported = 2,750
Population = 27,763
% of population reported positive = 9.9% County = Currituck
Cases reported = 2,750
Population = 27,763
% of population reported positive = 9.9% County = Currituck
Cases reported = 2,750
Population = 27,763
% of population reported positive = 9.9% County = Currituck
Cases reported = 2,750
Population = 27,763
% of population reported positive = 9.9% County = Currituck
Cases reported = 2,750
Population = 27,763
% of population reported positive = 9.9% County = Currituck
Cases reported = 2,750
Population = 27,763
% of population reported positive = 9.9% County = Currituck
Cases reported = 2,750
Population = 27,763
% of population reported positive = 9.9% County = Currituck
Cases reported = 2,750
Population = 27,763
% of population reported positive = 9.9% County = Currituck
Cases reported = 2,750
Population = 27,763
% of population reported positive = 9.9% County = Currituck
Cases reported = 2,750
Population = 27,763
% of population reported positive = 9.9% County = Currituck
Cases reported = 2,750
Population = 27,763
% of population reported positive = 9.9% County = Currituck
Cases reported = 2,750
Population = 27,763
% of population reported positive = 9.9% County = Currituck
Cases reported = 2,750
Population = 27,763
% of population reported positive = 9.9% County = Currituck
Cases reported = 2,750
Population = 27,763
% of population reported positive = 9.9% County = Currituck
Cases reported = 2,750
Population = 27,763
% of population reported positive = 9.9% County = Currituck
Cases reported = 2,750
Population = 27,763
% of population reported positive = 9.9% County = Currituck
Cases reported = 2,750
Population = 27,763
% of population reported positive = 9.9% County = Currituck
Cases reported = 2,750
Population = 27,763
% of population reported positive = 9.9% County = Currituck
Cases reported = 2,750
Population = 27,763
% of population reported positive = 9.9% County = Currituck
Cases reported = 2,750
Population = 27,763
% of population reported positive = 9.9% County = Currituck
Cases reported = 2,750
Population = 27,763
% of population reported positive = 9.9% County = Currituck
Cases reported = 2,750
Population = 27,763
% of population reported positive = 9.9% County = Currituck
Cases reported = 2,750
Population = 27,763
% of population reported positive = 9.9% County = Currituck
Cases reported = 2,750
Population = 27,763
% of population reported positive = 9.9% County = Currituck
Cases reported = 2,750
Population = 27,763
% of population reported positive = 9.9% County = Currituck
Cases reported = 2,750
Population = 27,763
% of population reported positive = 9.9% County = Currituck
Cases reported = 2,750
Population = 27,763
% of population reported positive = 9.9% County = Currituck
Cases reported = 2,750
Population = 27,763
% of population reported positive = 9.9% County = Currituck
Cases reported = 2,750
Population = 27,763
% of population reported positive = 9.9% County = Currituck
Cases reported = 2,750
Population = 27,763
% of population reported positive = 9.9% County = Currituck
Cases reported = 2,750
Population = 27,763
% of population reported positive = 9.9% County = Currituck
Cases reported = 2,750
Population = 27,763
% of population reported positive = 9.9% County = Currituck
Cases reported = 2,750
Population = 27,763
% of population reported positive = 9.9% County = Currituck
Cases reported = 2,750
Population = 27,763
% of population reported positive = 9.9% County = Currituck
Cases reported = 2,750
Population = 27,763
% of population reported positive = 9.9% County = Currituck
Cases reported = 2,750
Population = 27,763
% of population reported positive = 9.9% County = Currituck
Cases reported = 2,750
Population = 27,763
% of population reported positive = 9.9% County = Currituck
Cases reported = 2,750
Population = 27,763
% of population reported positive = 9.9% County = Currituck
Cases reported = 2,750
Population = 27,763
% of population reported positive = 9.9% County = Currituck
Cases reported = 2,750
Population = 27,763
% of population reported positive = 9.9% County = Currituck
Cases reported = 2,750
Population = 27,763
% of population reported positive = 9.9% County = Currituck
Cases reported = 2,750
Population = 27,763
% of population reported positive = 9.9% County = Currituck
Cases reported = 2,750
Population = 27,763
% of population reported positive = 9.9% County = Currituck
Cases reported = 2,750
Population = 27,763
% of population reported positive = 9.9% County = Currituck
Cases reported = 2,750
Population = 27,763
% of population reported positive = 9.9% County = Currituck
Cases reported = 2,750
Population = 27,763
% of population reported positive = 9.9% County = Currituck
Cases reported = 2,750
Population = 27,763
% of population reported positive = 9.9% County = Currituck
Cases reported = 2,750
Population = 27,763
% of population reported positive = 9.9% County = Currituck
Cases reported = 2,750
Population = 27,763
% of population reported positive = 9.9% County = Currituck
Cases reported = 2,750
Population = 27,763
% of population reported positive = 9.9% County = Currituck
Cases reported = 2,750
Population = 27,763
% of population reported positive = 9.9% County = Currituck
Cases reported = 2,750
Population = 27,763
% of population reported positive = 9.9% County = Currituck
Cases reported = 2,750
Population = 27,763
% of population reported positive = 9.9% County = Currituck
Cases reported = 2,750
Population = 27,763
% of population reported positive = 9.9% County = Currituck
Cases reported = 2,750
Population = 27,763
% of population reported positive = 9.9% County = Currituck
Cases reported = 2,750
Population = 27,763
% of population reported positive = 9.9% County = Currituck
Cases reported = 2,750
Population = 27,763
% of population reported positive = 9.9% County = Currituck
Cases reported = 2,750
Population = 27,763
% of population reported positive = 9.9% County = Chatham
Cases reported = 6,771
Population = 74,470
% of population reported positive = 9.1% County = Carteret
Cases reported = 8,377
Population = 69,473
% of population reported positive = 12.1% County = Carteret
Cases reported = 8,377
Population = 69,473
% of population reported positive = 12.1% County = Carteret
Cases reported = 8,377
Population = 69,473
% of population reported positive = 12.1% County = Carteret
Cases reported = 8,377
Population = 69,473
% of population reported positive = 12.1% County = Carteret
Cases reported = 8,377
Population = 69,473
% of population reported positive = 12.1% County = Carteret
Cases reported = 8,377
Population = 69,473
% of population reported positive = 12.1% County = Carteret
Cases reported = 8,377
Population = 69,473
% of population reported positive = 12.1% County = Carteret
Cases reported = 8,377
Population = 69,473
% of population reported positive = 12.1% County = Carteret
Cases reported = 8,377
Population = 69,473
% of population reported positive = 12.1% County = Carteret
Cases reported = 8,377
Population = 69,473
% of population reported positive = 12.1% County = Carteret
Cases reported = 8,377
Population = 69,473
% of population reported positive = 12.1% County = Carteret
Cases reported = 8,377
Population = 69,473
% of population reported positive = 12.1% County = Carteret
Cases reported = 8,377
Population = 69,473
% of population reported positive = 12.1% County = Carteret
Cases reported = 8,377
Population = 69,473
% of population reported positive = 12.1% County = Carteret
Cases reported = 8,377
Population = 69,473
% of population reported positive = 12.1% County = Carteret
Cases reported = 8,377
Population = 69,473
% of population reported positive = 12.1% County = Carteret
Cases reported = 8,377
Population = 69,473
% of population reported positive = 12.1% County = Carteret
Cases reported = 8,377
Population = 69,473
% of population reported positive = 12.1% County = Carteret
Cases reported = 8,377
Population = 69,473
% of population reported positive = 12.1% County = Carteret
Cases reported = 8,377
Population = 69,473
% of population reported positive = 12.1% County = Carteret
Cases reported = 8,377
Population = 69,473
% of population reported positive = 12.1% County = Carteret
Cases reported = 8,377
Population = 69,473
% of population reported positive = 12.1% County = Carteret
Cases reported = 8,377
Population = 69,473
% of population reported positive = 12.1% County = Carteret
Cases reported = 8,377
Population = 69,473
% of population reported positive = 12.1% County = Carteret
Cases reported = 8,377
Population = 69,473
% of population reported positive = 12.1% County = Carteret
Cases reported = 8,377
Population = 69,473
% of population reported positive = 12.1% County = Carteret
Cases reported = 8,377
Population = 69,473
% of population reported positive = 12.1% County = Carteret
Cases reported = 8,377
Population = 69,473
% of population reported positive = 12.1% County = Carteret
Cases reported = 8,377
Population = 69,473
% of population reported positive = 12.1% County = Carteret
Cases reported = 8,377
Population = 69,473
% of population reported positive = 12.1% County = Carteret
Cases reported = 8,377
Population = 69,473
% of population reported positive = 12.1% County = Carteret
Cases reported = 8,377
Population = 69,473
% of population reported positive = 12.1% County = Carteret
Cases reported = 8,377
Population = 69,473
% of population reported positive = 12.1% County = Carteret
Cases reported = 8,377
Population = 69,473
% of population reported positive = 12.1% County = Carteret
Cases reported = 8,377
Population = 69,473
% of population reported positive = 12.1% County = Carteret
Cases reported = 8,377
Population = 69,473
% of population reported positive = 12.1% County = Carteret
Cases reported = 8,377
Population = 69,473
% of population reported positive = 12.1% County = Carteret
Cases reported = 8,377
Population = 69,473
% of population reported positive = 12.1% County = Carteret
Cases reported = 8,377
Population = 69,473
% of population reported positive = 12.1% County = Carteret
Cases reported = 8,377
Population = 69,473
% of population reported positive = 12.1% County = Carteret
Cases reported = 8,377
Population = 69,473
% of population reported positive = 12.1% County = Carteret
Cases reported = 8,377
Population = 69,473
% of population reported positive = 12.1% County = Carteret
Cases reported = 8,377
Population = 69,473
% of population reported positive = 12.1% County = Carteret
Cases reported = 8,377
Population = 69,473
% of population reported positive = 12.1% County = Carteret
Cases reported = 8,377
Population = 69,473
% of population reported positive = 12.1% County = Carteret
Cases reported = 8,377
Population = 69,473
% of population reported positive = 12.1% County = Carteret
Cases reported = 8,377
Population = 69,473
% of population reported positive = 12.1% County = Carteret
Cases reported = 8,377
Population = 69,473
% of population reported positive = 12.1% County = Carteret
Cases reported = 8,377
Population = 69,473
% of population reported positive = 12.1% County = Carteret
Cases reported = 8,377
Population = 69,473
% of population reported positive = 12.1% County = Carteret
Cases reported = 8,377
Population = 69,473
% of population reported positive = 12.1% County = Carteret
Cases reported = 8,377
Population = 69,473
% of population reported positive = 12.1% County = Carteret
Cases reported = 8,377
Population = 69,473
% of population reported positive = 12.1% County = Carteret
Cases reported = 8,377
Population = 69,473
% of population reported positive = 12.1% County = Carteret
Cases reported = 8,377
Population = 69,473
% of population reported positive = 12.1% County = Carteret
Cases reported = 8,377
Population = 69,473
% of population reported positive = 12.1% County = Carteret
Cases reported = 8,377
Population = 69,473
% of population reported positive = 12.1% County = Carteret
Cases reported = 8,377
Population = 69,473
% of population reported positive = 12.1% County = Carteret
Cases reported = 8,377
Population = 69,473
% of population reported positive = 12.1% County = Carteret
Cases reported = 8,377
Population = 69,473
% of population reported positive = 12.1% County = Carteret
Cases reported = 8,377
Population = 69,473
% of population reported positive = 12.1% County = Carteret
Cases reported = 8,377
Population = 69,473
% of population reported positive = 12.1% County = Carteret
Cases reported = 8,377
Population = 69,473
% of population reported positive = 12.1% County = Carteret
Cases reported = 8,377
Population = 69,473
% of population reported positive = 12.1% County = Carteret
Cases reported = 8,377
Population = 69,473
% of population reported positive = 12.1% County = Carteret
Cases reported = 8,377
Population = 69,473
% of population reported positive = 12.1% County = Carteret
Cases reported = 8,377
Population = 69,473
% of population reported positive = 12.1% County = Carteret
Cases reported = 8,377
Population = 69,473
% of population reported positive = 12.1% County = Carteret
Cases reported = 8,377
Population = 69,473
% of population reported positive = 12.1% County = Carteret
Cases reported = 8,377
Population = 69,473
% of population reported positive = 12.1% County = Carteret
Cases reported = 8,377
Population = 69,473
% of population reported positive = 12.1% County = Carteret
Cases reported = 8,377
Population = 69,473
% of population reported positive = 12.1% County = Carteret
Cases reported = 8,377
Population = 69,473
% of population reported positive = 12.1% County = Carteret
Cases reported = 8,377
Population = 69,473
% of population reported positive = 12.1% County = Carteret
Cases reported = 8,377
Population = 69,473
% of population reported positive = 12.1% County = Carteret
Cases reported = 8,377
Population = 69,473
% of population reported positive = 12.1% County = Camden
Cases reported = 1,145
Population = 10,867
% of population reported positive = 10.5% County = Buncombe
Cases reported = 28,191
Population = 261,191
% of population reported positive = 10.8% County = Brunswick
Cases reported = 16,298
Population = 142,820
% of population reported positive = 11.4% County = Brunswick
Cases reported = 16,298
Population = 142,820
% of population reported positive = 11.4% County = Brunswick
Cases reported = 16,298
Population = 142,820
% of population reported positive = 11.4% County = Brunswick
Cases reported = 16,298
Population = 142,820
% of population reported positive = 11.4% County = Brunswick
Cases reported = 16,298
Population = 142,820
% of population reported positive = 11.4% County = Brunswick
Cases reported = 16,298
Population = 142,820
% of population reported positive = 11.4% County = Brunswick
Cases reported = 16,298
Population = 142,820
% of population reported positive = 11.4% County = Brunswick
Cases reported = 16,298
Population = 142,820
% of population reported positive = 11.4% County = Brunswick
Cases reported = 16,298
Population = 142,820
% of population reported positive = 11.4% County = Brunswick
Cases reported = 16,298
Population = 142,820
% of population reported positive = 11.4% County = Brunswick
Cases reported = 16,298
Population = 142,820
% of population reported positive = 11.4% County = Brunswick
Cases reported = 16,298
Population = 142,820
% of population reported positive = 11.4% County = Brunswick
Cases reported = 16,298
Population = 142,820
% of population reported positive = 11.4% County = Brunswick
Cases reported = 16,298
Population = 142,820
% of population reported positive = 11.4% County = Brunswick
Cases reported = 16,298
Population = 142,820
% of population reported positive = 11.4% County = Brunswick
Cases reported = 16,298
Population = 142,820
% of population reported positive = 11.4% County = Brunswick
Cases reported = 16,298
Population = 142,820
% of population reported positive = 11.4% County = Brunswick
Cases reported = 16,298
Population = 142,820
% of population reported positive = 11.4% County = Brunswick
Cases reported = 16,298
Population = 142,820
% of population reported positive = 11.4% County = Brunswick
Cases reported = 16,298
Population = 142,820
% of population reported positive = 11.4% County = Brunswick
Cases reported = 16,298
Population = 142,820
% of population reported positive = 11.4% County = Brunswick
Cases reported = 16,298
Population = 142,820
% of population reported positive = 11.4% County = Brunswick
Cases reported = 16,298
Population = 142,820
% of population reported positive = 11.4% County = Brunswick
Cases reported = 16,298
Population = 142,820
% of population reported positive = 11.4% County = Brunswick
Cases reported = 16,298
Population = 142,820
% of population reported positive = 11.4% County = Brunswick
Cases reported = 16,298
Population = 142,820
% of population reported positive = 11.4% County = Brunswick
Cases reported = 16,298
Population = 142,820
% of population reported positive = 11.4% County = Brunswick
Cases reported = 16,298
Population = 142,820
% of population reported positive = 11.4% County = Brunswick
Cases reported = 16,298
Population = 142,820
% of population reported positive = 11.4% County = Brunswick
Cases reported = 16,298
Population = 142,820
% of population reported positive = 11.4% County = Brunswick
Cases reported = 16,298
Population = 142,820
% of population reported positive = 11.4% County = Brunswick
Cases reported = 16,298
Population = 142,820
% of population reported positive = 11.4% County = Brunswick
Cases reported = 16,298
Population = 142,820
% of population reported positive = 11.4% County = Brunswick
Cases reported = 16,298
Population = 142,820
% of population reported positive = 11.4% County = Brunswick
Cases reported = 16,298
Population = 142,820
% of population reported positive = 11.4% County = Brunswick
Cases reported = 16,298
Population = 142,820
% of population reported positive = 11.4% County = Brunswick
Cases reported = 16,298
Population = 142,820
% of population reported positive = 11.4% County = Brunswick
Cases reported = 16,298
Population = 142,820
% of population reported positive = 11.4% County = Brunswick
Cases reported = 16,298
Population = 142,820
% of population reported positive = 11.4% County = Brunswick
Cases reported = 16,298
Population = 142,820
% of population reported positive = 11.4% County = Brunswick
Cases reported = 16,298
Population = 142,820
% of population reported positive = 11.4% County = Brunswick
Cases reported = 16,298
Population = 142,820
% of population reported positive = 11.4% County = Brunswick
Cases reported = 16,298
Population = 142,820
% of population reported positive = 11.4% County = Brunswick
Cases reported = 16,298
Population = 142,820
% of population reported positive = 11.4% County = Brunswick
Cases reported = 16,298
Population = 142,820
% of population reported positive = 11.4% County = Brunswick
Cases reported = 16,298
Population = 142,820
% of population reported positive = 11.4% County = Brunswick
Cases reported = 16,298
Population = 142,820
% of population reported positive = 11.4% County = Brunswick
Cases reported = 16,298
Population = 142,820
% of population reported positive = 11.4% County = Brunswick
Cases reported = 16,298
Population = 142,820
% of population reported positive = 11.4% County = Brunswick
Cases reported = 16,298
Population = 142,820
% of population reported positive = 11.4% County = Brunswick
Cases reported = 16,298
Population = 142,820
% of population reported positive = 11.4% County = Ashe
Cases reported = 3,443
Population = 27,203
% of population reported positive = 12.7%
The SGMap Procedure


 County = Orange 
 Reported positive = 11,838 
 Population = 148,476 
 Percent positive = 8.00%  County = Chatham 
 Reported positive = 6,771 
 Population = 74,470 
 Percent positive = 9.10%  County = Gates 
 Reported positive = 1,088 
 Population = 11,562 
 Percent positive = 9.40%  County = Currituck 
 Reported positive = 2,750 
 Population = 27,763 
 Percent positive = 9.90%  County = Dare 
 Reported positive = 3,850 
 Population = 37,009 
 Percent positive = 10.4%  County = Camden 
 Reported positive = 1,145 
 Population = 10,867 
 Percent positive = 10.5%  County = Durham 
 Reported positive = 34,630 
 Population = 321,488 
 Percent positive = 10.8%  County = Buncombe 
 Reported positive = 28,191 
 Population = 261,191 
 Percent positive = 10.8%  County = Transylvania 
 Reported positive = 3,888 
 Population = 34,385 
 Percent positive = 11.3%  County = Polk 
 Reported positive = 2,335 
 Population = 20,724 
 Percent positive = 11.3%  County = Brunswick 
 Reported positive = 16,298 
 Population = 142,820 
 Percent positive = 11.4%  County = Wake 
 Reported positive = 129,210 
 Population = 1111761 
 Percent positive = 11.6%  County = Perquimans 
 Reported positive = 1,558 
 Population = 13,463 
 Percent positive = 11.6%  County = Watauga 
 Reported positive = 6,636 
 Population = 56,177 
 Percent positive = 11.8%  County = Haywood 
 Reported positive = 7,464 
 Population = 62,317 
 Percent positive = 12.0%  County = Warren 
 Reported positive = 2,388 
 Population = 19,731 
 Percent positive = 12.1%  County = Hertford 
 Reported positive = 2,856 
 Population = 23,677 
 Percent positive = 12.1%  County = Carteret 
 Reported positive = 8,377 
 Population = 69,473 
 Percent positive = 12.1%  County = New Hanover 
 Reported positive = 28,699 
 Population = 234,473 
 Percent positive = 12.2%  County = Guilford 
 Reported positive = 67,913 
 Population = 537,174 
 Percent positive = 12.6%  County = Ashe 
 Reported positive = 3,443 
 Population = 27,203 
 Percent positive = 12.7%  County = Madison 
 Reported positive = 2,781 
 Population = 21,755 
 Percent positive = 12.8%  County = Person 
 Reported positive = 5,105 
 Population = 39,490 
 Percent positive = 12.9%  County = Jackson 
 Reported positive = 5,652 
 Population = 43,938 
 Percent positive = 12.9%  County = Hoke 
 Reported positive = 7,143 
 Population = 55,234 
 Percent positive = 12.9%  County = Henderson 
 Reported positive = 15,230 
 Population = 117,417 
 Percent positive = 13.0%  County = Bertie 
 Reported positive = 2,475 
 Population = 18,947 
 Percent positive = 13.1%  County = Pasquotank 
 Reported positive = 5,249 
 Population = 39,824 
 Percent positive = 13.2%  County = Granville 
 Reported positive = 7,952 
 Population = 60,443 
 Percent positive = 13.2%  County = Northampton 
 Reported positive = 2,599 
 Population = 19,483 
 Percent positive = 13.3%  County = Wayne 
 Reported positive = 16,447 
 Population = 123,131 
 Percent positive = 13.4%  County = Rockingham 
 Reported positive = 12,184 
 Population = 91,010 
 Percent positive = 13.4%  County = Pamlico 
 Reported positive = 1,719 
 Population = 12,726 
 Percent positive = 13.5%  County = Moore 
 Reported positive = 13,666 
 Population = 100,880 
 Percent positive = 13.5%  County = Forsyth 
 Reported positive = 51,785 
 Population = 382,295 
 Percent positive = 13.5%  County = Harnett 
 Reported positive = 18,470 
 Population = 135,976 
 Percent positive = 13.6%  County = Cumberland 
 Reported positive = 45,623 
 Population = 335,509 
 Percent positive = 13.6%  County = Tyrrell 
 Reported positive = 552 
 Population = 4,016 
 Percent positive = 13.7%  County = Stokes 
 Reported positive = 6,257 
 Population = 45,591 
 Percent positive = 13.7%  County = Mitchell 
 Reported positive = 2,057 
 Population = 14,964 
 Percent positive = 13.7%  County = Washington 
 Reported positive = 1,593 
 Population = 11,580 
 Percent positive = 13.8%  County = Swain 
 Reported positive = 1,972 
 Population = 14,271 
 Percent positive = 13.8%  County = Macon 
 Reported positive = 4,970 
 Population = 35,858 
 Percent positive = 13.9%  County = Pender 
 Reported positive = 8,805 
 Population = 63,060 
 Percent positive = 14.0%  County = Craven 
 Reported positive = 14,286 
 Population = 102,139 
 Percent positive = 14.0%  County = Caswell 
 Reported positive = 3,195 
 Population = 22,604 
 Percent positive = 14.1%  County = Mecklenburg 
 Reported positive = 157,260 
 Population = 1110356 
 Percent positive = 14.2%  County = Franklin 
 Reported positive = 9,907 
 Population = 69,685 
 Percent positive = 14.2%  County = Jones 
 Reported positive = 1,351 
 Population = 9,419 
 Percent positive = 14.3%  County = Alleghany 
 Reported positive = 1,614 
 Population = 11,137 
 Percent positive = 14.5%  County = Clay 
 Reported positive = 1,656 
 Population = 11,231 
 Percent positive = 14.7%  County = Onslow 
 Reported positive = 29,587 
 Population = 197,938 
 Percent positive = 14.9%  County = Davie 
 Reported positive = 6,435 
 Population = 42,846 
 Percent positive = 15.0%  County = Union 
 Reported positive = 36,383 
 Population = 239,859 
 Percent positive = 15.2%  County = Randolph 
 Reported positive = 21,865 
 Population = 143,667 
 Percent positive = 15.2%  County = Cabarrus 
 Reported positive = 32,853 
 Population = 216,453 
 Percent positive = 15.2%  County = Lee 
 Reported positive = 9,434 
 Population = 61,779 
 Percent positive = 15.3%  County = Beaufort 
 Reported positive = 7,179 
 Population = 46,994 
 Percent positive = 15.3%  County = Vance 
 Reported positive = 6,838 
 Population = 44,535 
 Percent positive = 15.4%  County = Edgecombe 
 Reported positive = 7,949 
 Population = 51,472 
 Percent positive = 15.4%  County = Davidson 
 Reported positive = 25,786 
 Population = 167,609 
 Percent positive = 15.4%  County = Wilkes 
 Reported positive = 10,570 
 Population = 68,412 
 Percent positive = 15.5%  County = Johnston 
 Reported positive = 32,416 
 Population = 209,339 
 Percent positive = 15.5%  County = Yancey 
 Reported positive = 2,823 
 Population = 18,069 
 Percent positive = 15.6%  County = Avery 
 Reported positive = 2,735 
 Population = 17,557 
 Percent positive = 15.6%  County = Alamance 
 Reported positive = 26,393 
 Population = 169,509 
 Percent positive = 15.6%  County = Greene 
 Reported positive = 3,318 
 Population = 21,069 
 Percent positive = 15.7%  County = Halifax 
 Reported positive = 7,918 
 Population = 50,010 
 Percent positive = 15.8%  County = Graham 
 Reported positive = 1,330 
 Population = 8,441 
 Percent positive = 15.8%  County = Anson 
 Reported positive = 3,856 
 Population = 24,446 
 Percent positive = 15.8%  County = Yadkin 
 Reported positive = 6,005 
 Population = 37,667 
 Percent positive = 15.9%  County = Richmond 
 Reported positive = 7,125 
 Population = 44,829 
 Percent positive = 15.9%  County = Iredell 
 Reported positive = 28,885 
 Population = 181,806 
 Percent positive = 15.9%  County = Wilson 
 Reported positive = 13,237 
 Population = 81,801 
 Percent positive = 16.2%  County = Nash 
 Reported positive = 15,256 
 Population = 94,298 
 Percent positive = 16.2%  County = Cherokee 
 Reported positive = 4,643 
 Population = 28,612 
 Percent positive = 16.2%  County = Martin 
 Reported positive = 3,651 
 Population = 22,440 
 Percent positive = 16.3%  County = Caldwell 
 Reported positive = 13,418 
 Population = 82,178 
 Percent positive = 16.3%  County = Pitt 
 Reported positive = 29,706 
 Population = 180,742 
 Percent positive = 16.4%  County = Scotland 
 Reported positive = 5,735 
 Population = 34,823 
 Percent positive = 16.5%  County = Chowan 
 Reported positive = 2,297 
 Population = 13,943 
 Percent positive = 16.5%  County = Montgomery 
 Reported positive = 4,542 
 Population = 27,173 
 Percent positive = 16.7%  County = Hyde 
 Reported positive = 826 
 Population = 4,937 
 Percent positive = 16.7%  County = Bladen 
 Reported positive = 5,476 
 Population = 32,722 
 Percent positive = 16.7%  County = Lenoir 
 Reported positive = 9,483 
 Population = 55,949 
 Percent positive = 16.9%  County = Duplin 
 Reported positive = 9,972 
 Population = 58,741 
 Percent positive = 17.0%  County = Rutherford 
 Reported positive = 11,433 
 Population = 67,029 
 Percent positive = 17.1%  County = Surry 
 Reported positive = 12,425 
 Population = 71,783 
 Percent positive = 17.3%  County = Alexander 
 Reported positive = 6,469 
 Population = 37,497 
 Percent positive = 17.3%  County = Lincoln 
 Reported positive = 14,999 
 Population = 86,111 
 Percent positive = 17.4%  County = Burke 
 Reported positive = 15,745 
 Population = 90,485 
 Percent positive = 17.4%  County = Sampson 
 Reported positive = 11,296 
 Population = 63,531 
 Percent positive = 17.8%  County = Gaston 
 Reported positive = 40,027 
 Population = 224,529 
 Percent positive = 17.8%  County = Catawba 
 Reported positive = 28,347 
 Population = 159,551 
 Percent positive = 17.8%  County = Columbus 
 Reported positive = 10,086 
 Population = 55,508 
 Percent positive = 18.2%  County = Rowan 
 Reported positive = 26,221 
 Population = 142,088 
 Percent positive = 18.5%  County = Stanly 
 Reported positive = 11,652 
 Population = 62,806 
 Percent positive = 18.6%  County = Cleveland 
 Reported positive = 18,367 
 Population = 97,947 
 Percent positive = 18.8%  County = McDowell 
 Reported positive = 8,647 
 Population = 45,756 
 Percent positive = 18.9%  County = Robeson 
 Reported positive = 24,992 
 Population = 130,625 
 Percent positive = 19.1%
The SGPlot Procedure


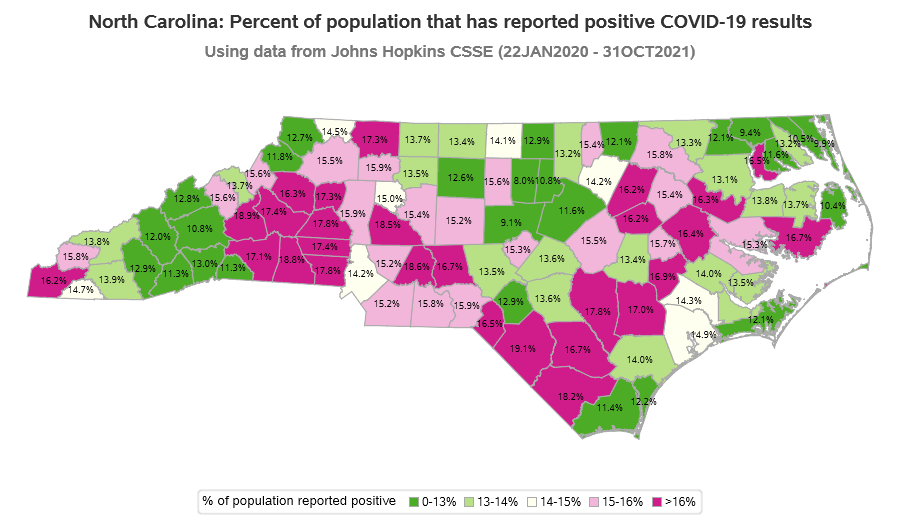
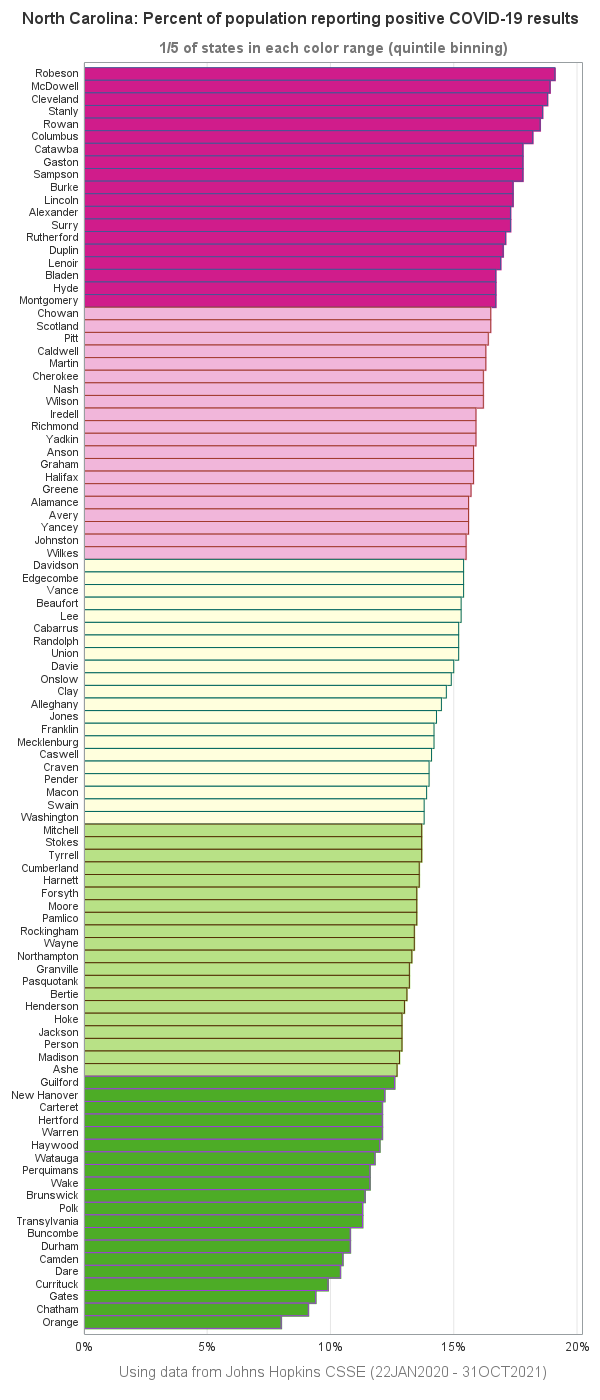
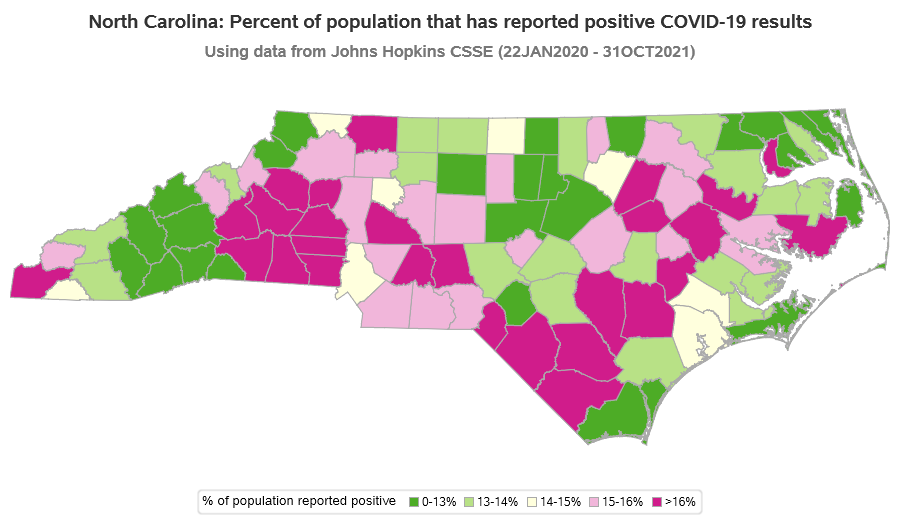
North Carolina: Percent of population reporting positive COVID-19 results
1/5 of states in each color range (quintile binning)

Obs County Cases reported Population % of population
reported positive
1 Alamance 26,393 169,509 15.6%
2 Alexander 6,469 37,497 17.3%
3 Alleghany 1,614 11,137 14.5%
4 Anson 3,856 24,446 15.8%
5 Ashe 3,443 27,203 12.7%
6 Avery 2,735 17,557 15.6%
7 Beaufort 7,179 46,994 15.3%
8 Bertie 2,475 18,947 13.1%
9 Bladen 5,476 32,722 16.7%
10 Brunswick 16,298 142,820 11.4%
11 Buncombe 28,191 261,191 10.8%
12 Burke 15,745 90,485 17.4%
13 Cabarrus 32,853 216,453 15.2%
14 Caldwell 13,418 82,178 16.3%
15 Camden 1,145 10,867 10.5%
16 Carteret 8,377 69,473 12.1%
17 Caswell 3,195 22,604 14.1%
18 Catawba 28,347 159,551 17.8%
19 Chatham 6,771 74,470 9.1%
20 Cherokee 4,643 28,612 16.2%
21 Chowan 2,297 13,943 16.5%
22 Clay 1,656 11,231 14.7%
23 Cleveland 18,367 97,947 18.8%
24 Columbus 10,086 55,508 18.2%
25 Craven 14,286 102,139 14.0%
26 Cumberland 45,623 335,509 13.6%
27 Currituck 2,750 27,763 9.9%
28 Dare 3,850 37,009 10.4%
29 Davidson 25,786 167,609 15.4%
30 Davie 6,435 42,846 15.0%
31 Duplin 9,972 58,741 17.0%
32 Durham 34,630 321,488 10.8%
33 Edgecombe 7,949 51,472 15.4%
34 Forsyth 51,785 382,295 13.5%
35 Franklin 9,907 69,685 14.2%
36 Gaston 40,027 224,529 17.8%
37 Gates 1,088 11,562 9.4%
38 Graham 1,330 8,441 15.8%
39 Granville 7,952 60,443 13.2%
40 Greene 3,318 21,069 15.7%
41 Guilford 67,913 537,174 12.6%
42 Halifax 7,918 50,010 15.8%
43 Harnett 18,470 135,976 13.6%
44 Haywood 7,464 62,317 12.0%
45 Henderson 15,230 117,417 13.0%
46 Hertford 2,856 23,677 12.1%
47 Hoke 7,143 55,234 12.9%
48 Hyde 826 4,937 16.7%
49 Iredell 28,885 181,806 15.9%
50 Jackson 5,652 43,938 12.9%
51 Johnston 32,416 209,339 15.5%
52 Jones 1,351 9,419 14.3%
53 Lee 9,434 61,779 15.3%
54 Lenoir 9,483 55,949 16.9%
55 Lincoln 14,999 86,111 17.4%
56 Macon 4,970 35,858 13.9%
57 Madison 2,781 21,755 12.8%
58 Martin 3,651 22,440 16.3%
59 McDowell 8,647 45,756 18.9%
60 Mecklenburg 157,260 1,110,356 14.2%
61 Mitchell 2,057 14,964 13.7%
62 Montgomery 4,542 27,173 16.7%
63 Moore 13,666 100,880 13.5%
64 Nash 15,256 94,298 16.2%
65 New Hanover 28,699 234,473 12.2%
66 Northampton 2,599 19,483 13.3%
67 Onslow 29,587 197,938 14.9%
68 Orange 11,838 148,476 8.0%
69 Pamlico 1,719 12,726 13.5%
70 Pasquotank 5,249 39,824 13.2%
71 Pender 8,805 63,060 14.0%
72 Perquimans 1,558 13,463 11.6%
73 Person 5,105 39,490 12.9%
74 Pitt 29,706 180,742 16.4%
75 Polk 2,335 20,724 11.3%
76 Randolph 21,865 143,667 15.2%
77 Richmond 7,125 44,829 15.9%
78 Robeson 24,992 130,625 19.1%
79 Rockingham 12,184 91,010 13.4%
80 Rowan 26,221 142,088 18.5%
81 Rutherford 11,433 67,029 17.1%
82 Sampson 11,296 63,531 17.8%
83 Scotland 5,735 34,823 16.5%
84 Stanly 11,652 62,806 18.6%
85 Stokes 6,257 45,591 13.7%
86 Surry 12,425 71,783 17.3%
87 Swain 1,972 14,271 13.8%
88 Transylvania 3,888 34,385 11.3%
89 Tyrrell 552 4,016 13.7%
90 Union 36,383 239,859 15.2%
91 Vance 6,838 44,535 15.4%
92 Wake 129,210 1,111,761 11.6%
93 Warren 2,388 19,731 12.1%
94 Washington 1,593 11,580 13.8%
95 Watauga 6,636 56,177 11.8%
96 Wayne 16,447 123,131 13.4%
97 Wilkes 10,570 68,412 15.5%
98 Wilson 13,237 81,801 16.2%
99 Yadkin 6,005 37,667 15.9%
100 Yancey 2,823 18,069 15.6%

Using data from Johns Hopkins CSSE (22JAN2020 - 31OCT2021)