Robert Allison's SAS ODS Graphics Samples #3
Click thumbnail to see full-size chart, click label to see SAS code.
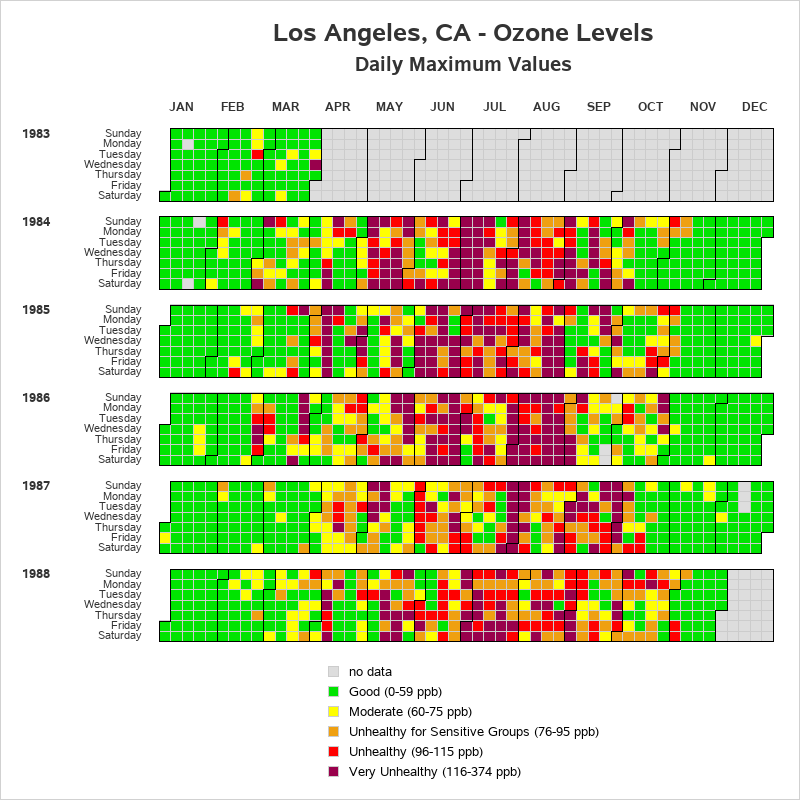
Ozone Calendar Chart
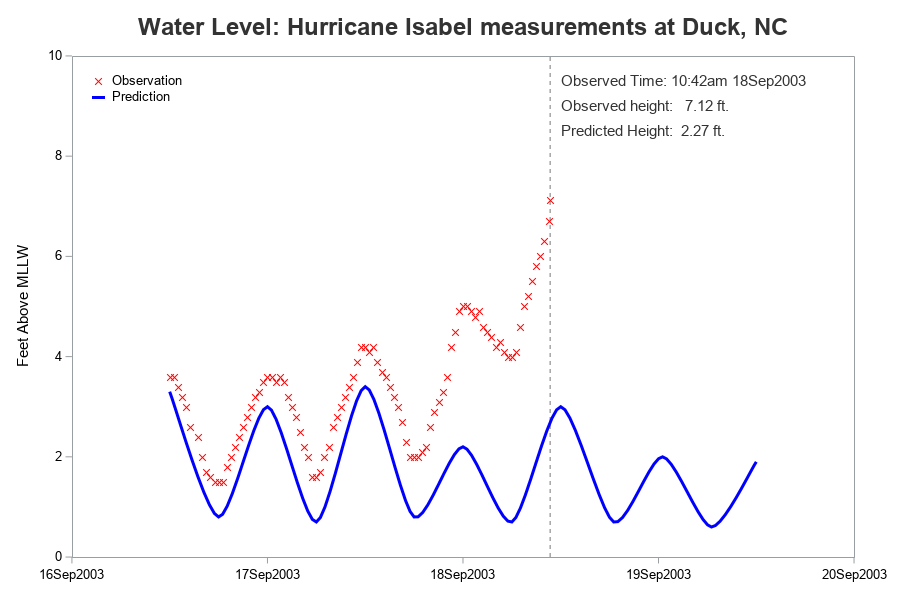
Hurricanes & Tides
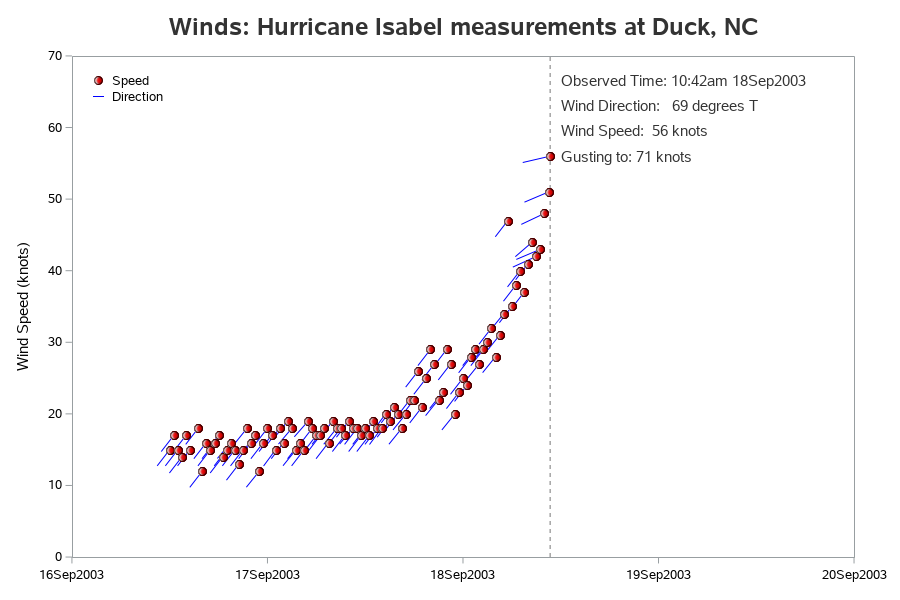
Hurricanes & Winds
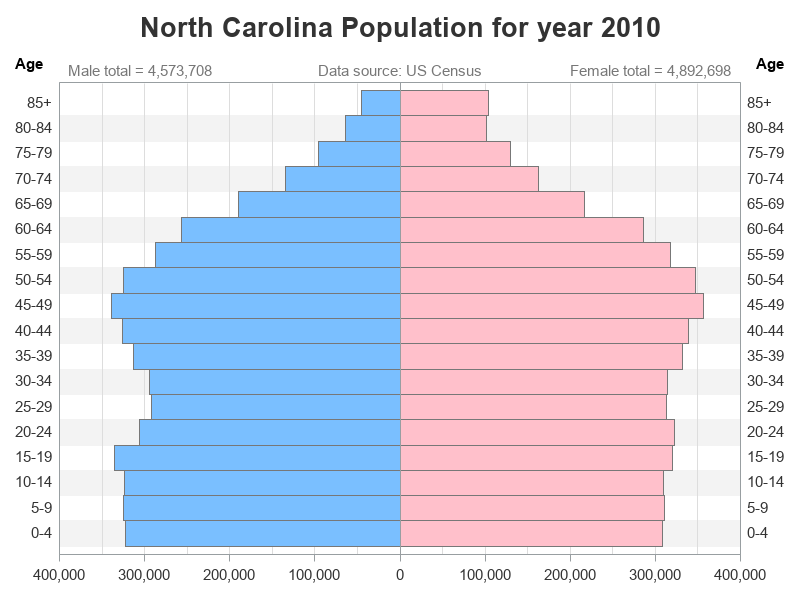
Population Chart
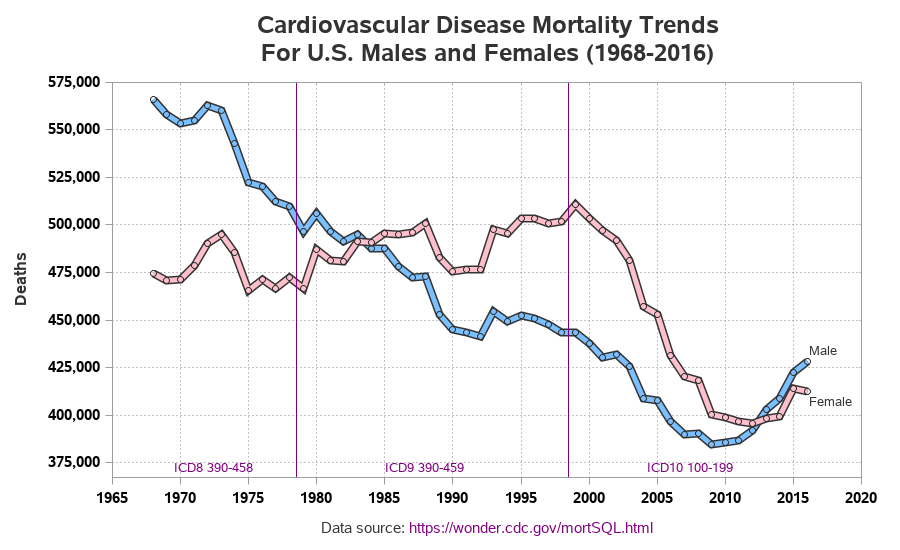
Cardiovascular M/F
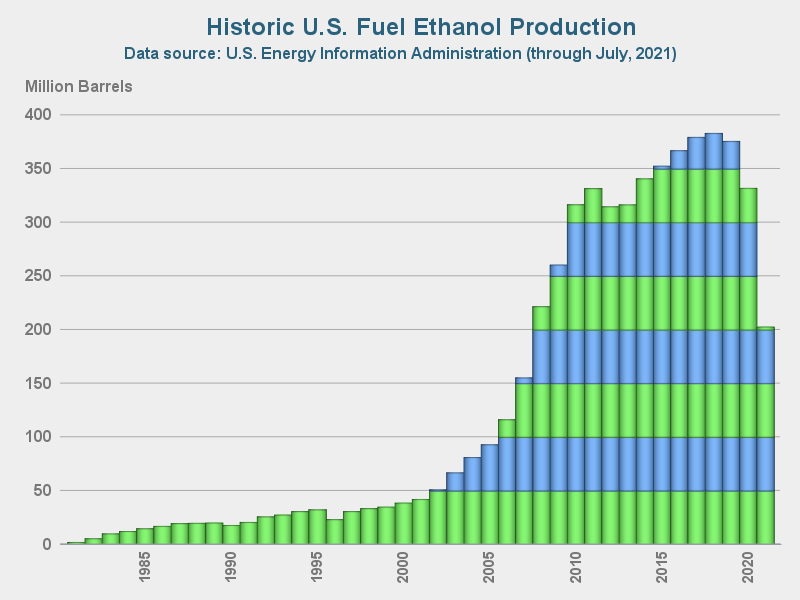
US Ethanol Production
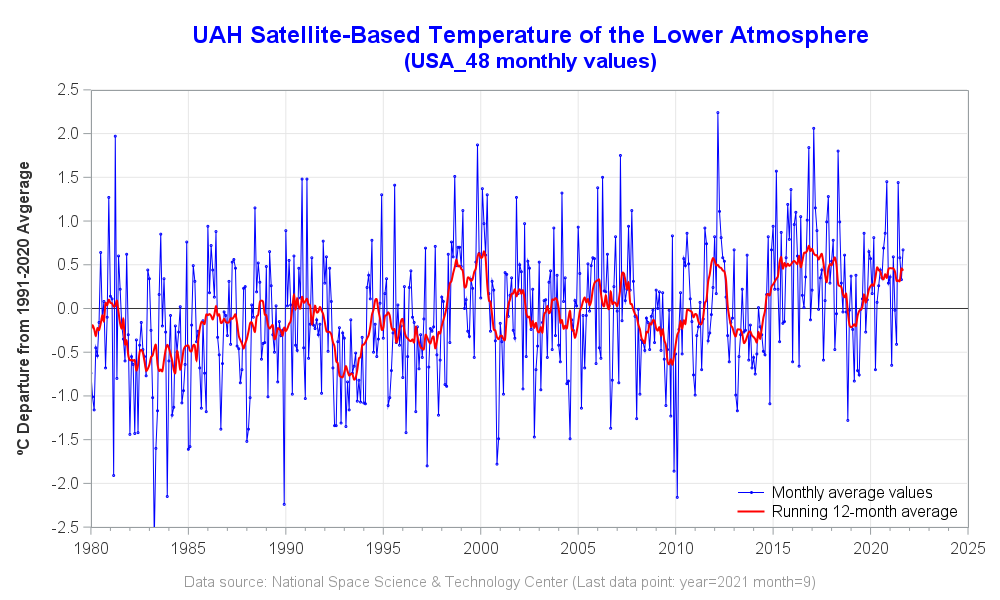
Temperature Graphs
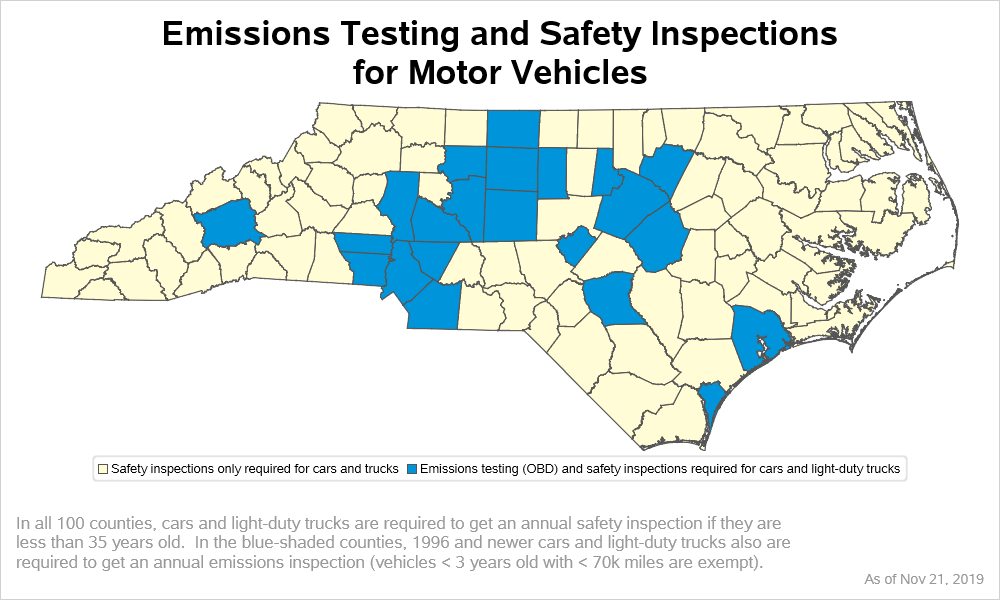
Emissions Inspection
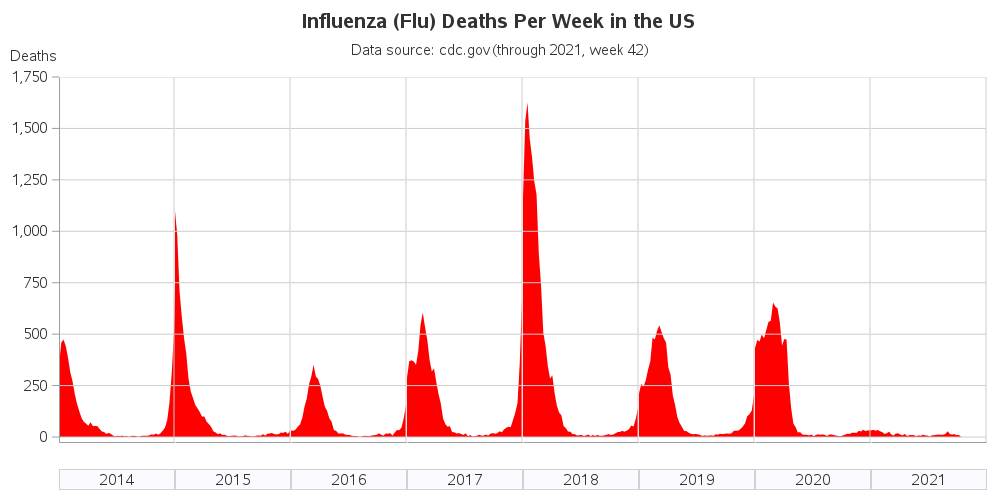
Flu Deaths in the US
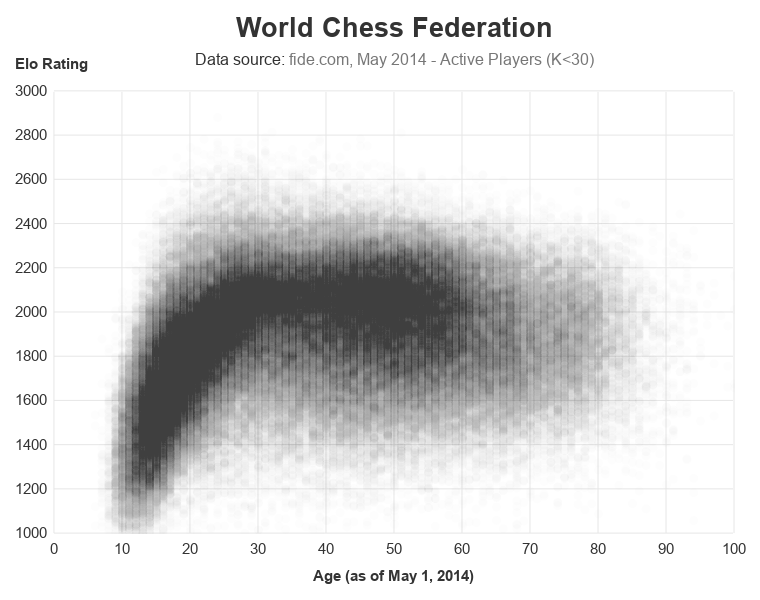
Chess Rating & Age
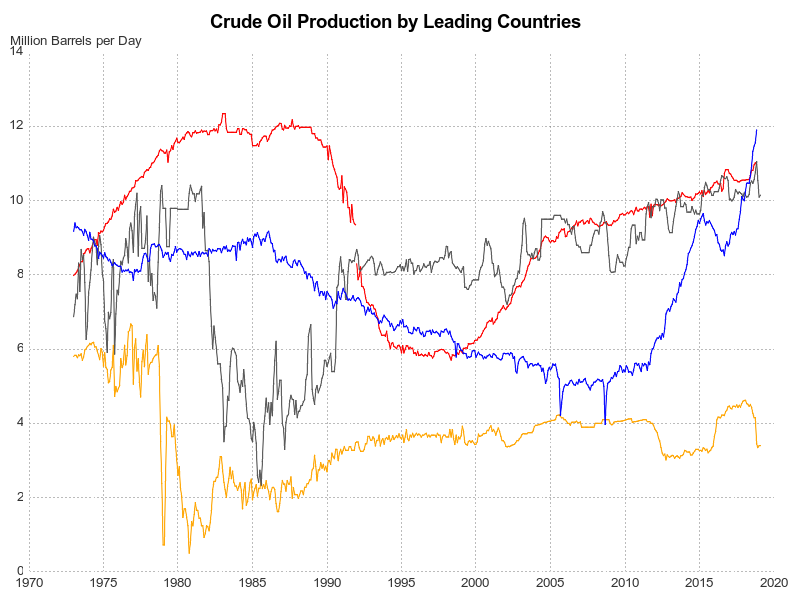
Oil Production Plot
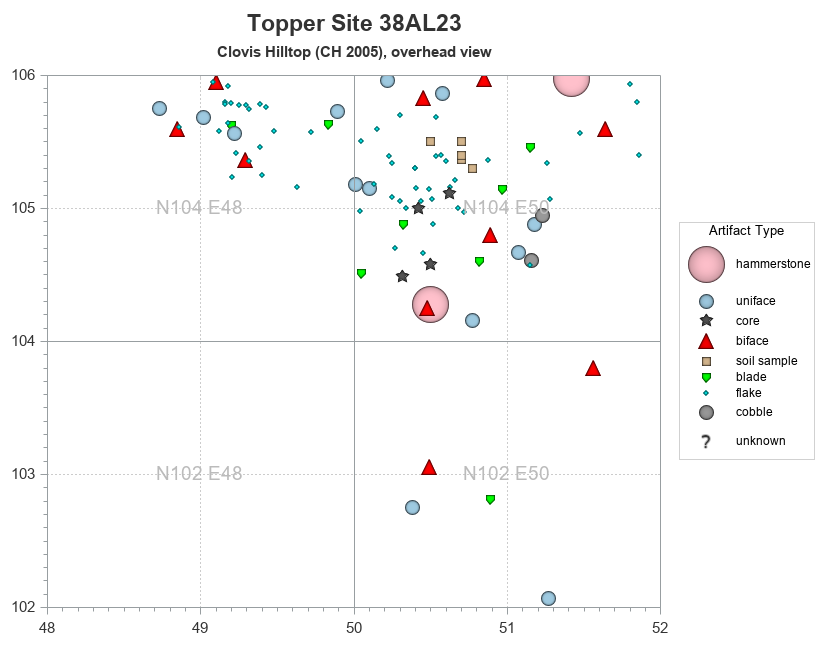
Virtual Archaeology
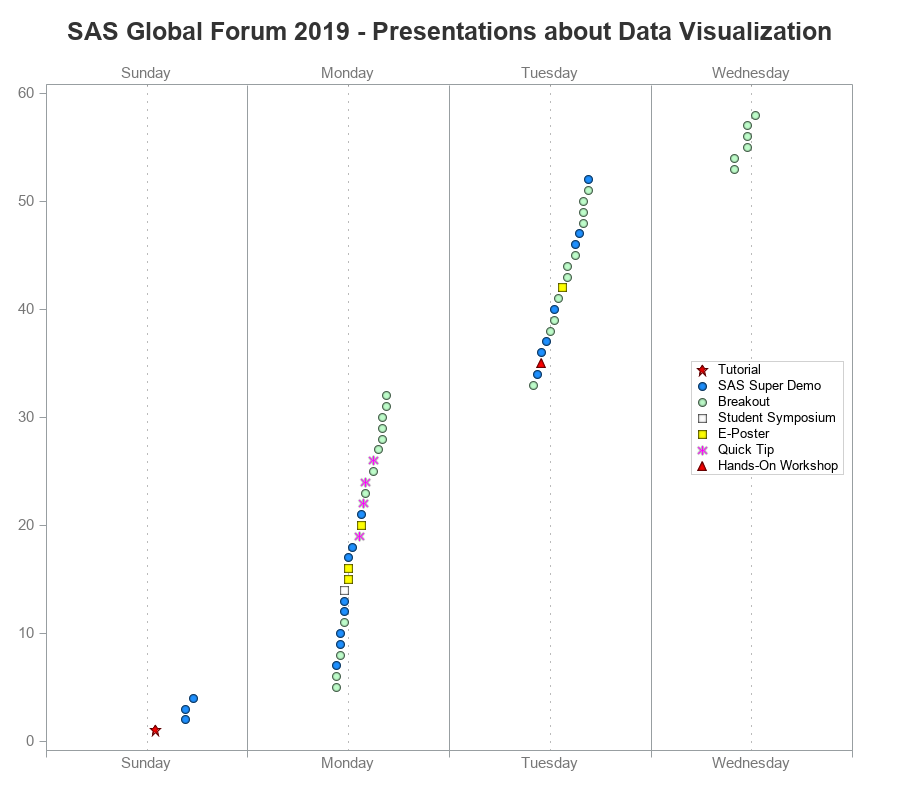
2019 Global Forum
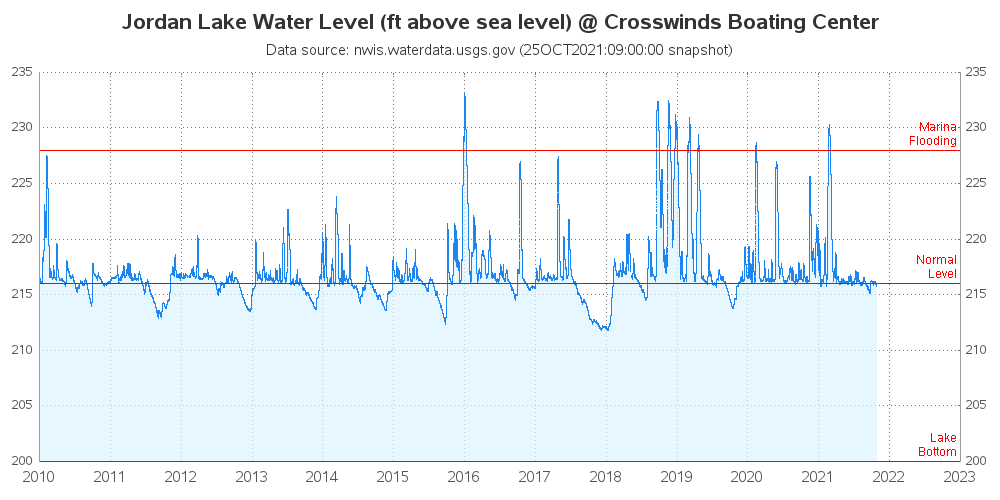
Jordan Lake Flooding
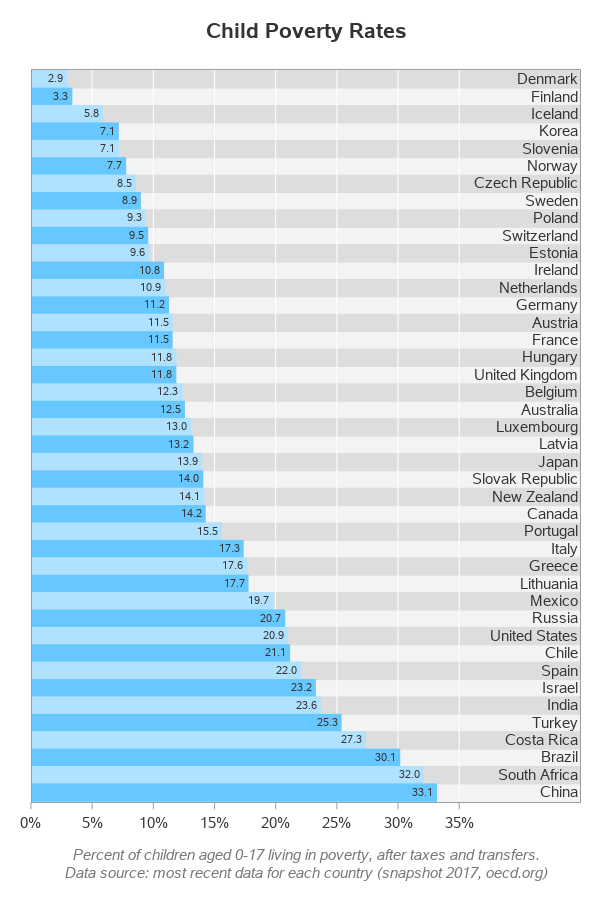
World Child Poverty
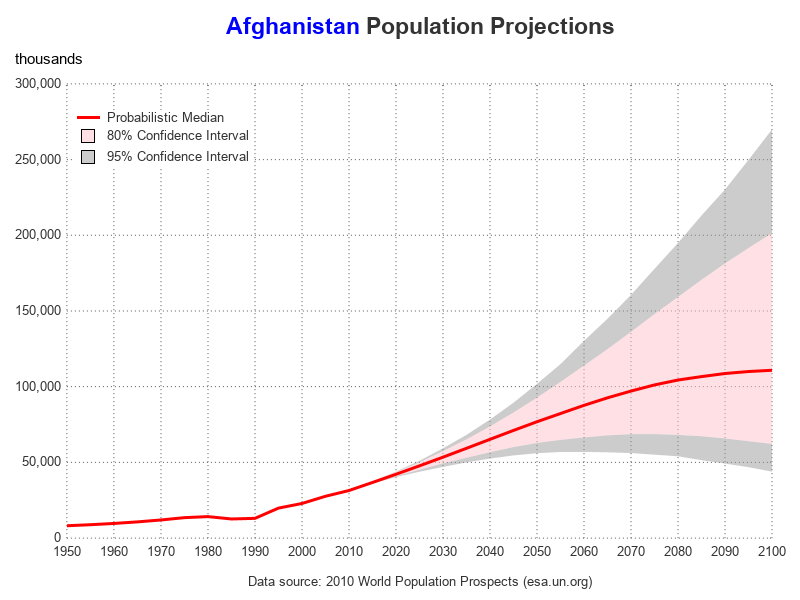
Population Graphs
Send feedback via email to Robert Allison
Please see the following README