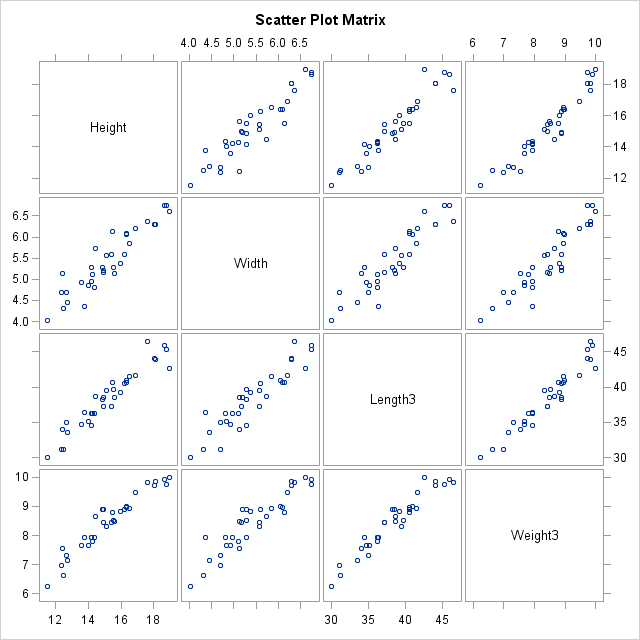
| PROC CORR Scatter Plot Matrix |
| Fish Measurement Data |
The CORR Procedure
| 4 Variables: | Height Width Length3 Weight3 |
|---|
| Simple Statistics | ||||||
|---|---|---|---|---|---|---|
| Variable | N | Mean | Std Dev | Sum | Minimum | Maximum |
| Height | 34 | 15.22057 | 1.98159 | 517.49950 | 11.52000 | 18.95700 |
| Width | 34 | 5.43805 | 0.72967 | 184.89370 | 4.02000 | 6.74970 |
| Length3 | 34 | 38.38529 | 4.21628 | 1305 | 30.00000 | 46.50000 |
| Weight3 | 34 | 8.44751 | 0.97574 | 287.21524 | 6.23168 | 10.00000 |
| Pearson Correlation Coefficients, N = 34 Prob > |r| under H0: Rho=0 |
||||||||||||
|---|---|---|---|---|---|---|---|---|---|---|---|---|
| Height | Width | Length3 | Weight3 | |||||||||
| Height |
|
|
|
|
||||||||
| Width |
|
|
|
|
||||||||
| Length3 |
|
|
|
|
||||||||
| Weight3 |
|
|
|
|
||||||||