Robert Allison's COVID SAS Graphs
Click on thumbnail to see full-size chart. Click on label to see descriptions and SAS code.
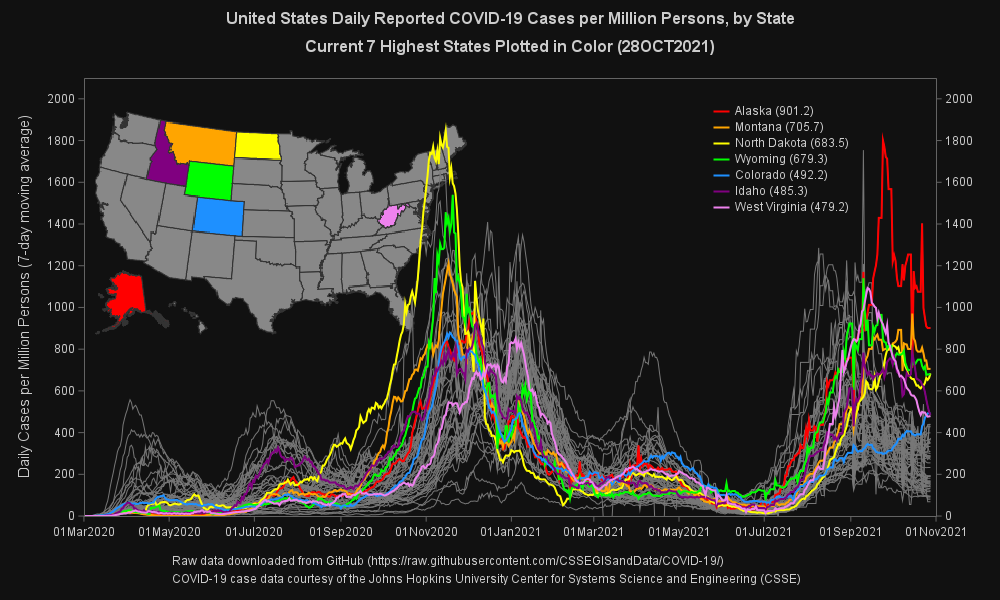
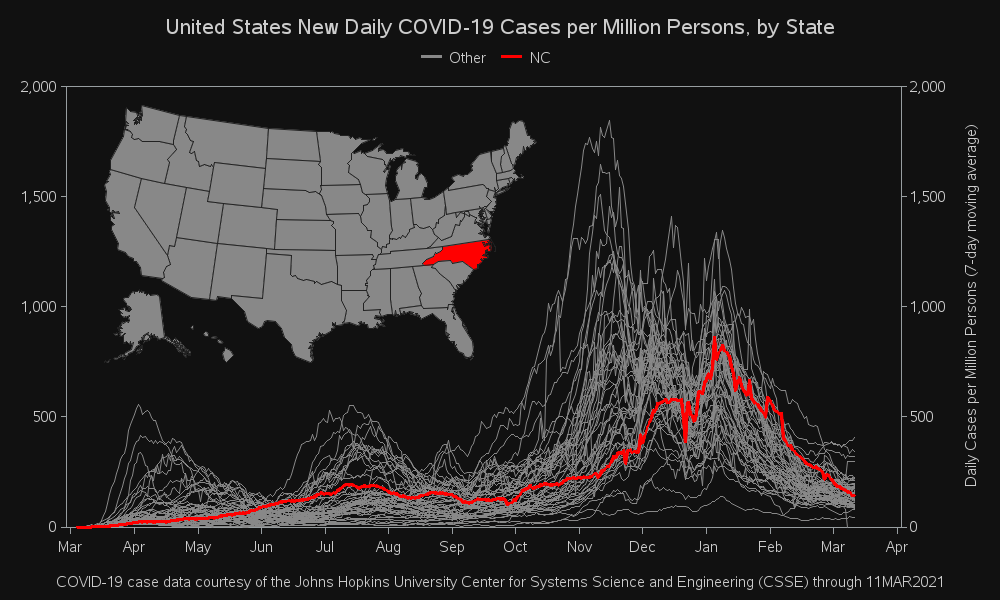
Cases Spaghetti Plot
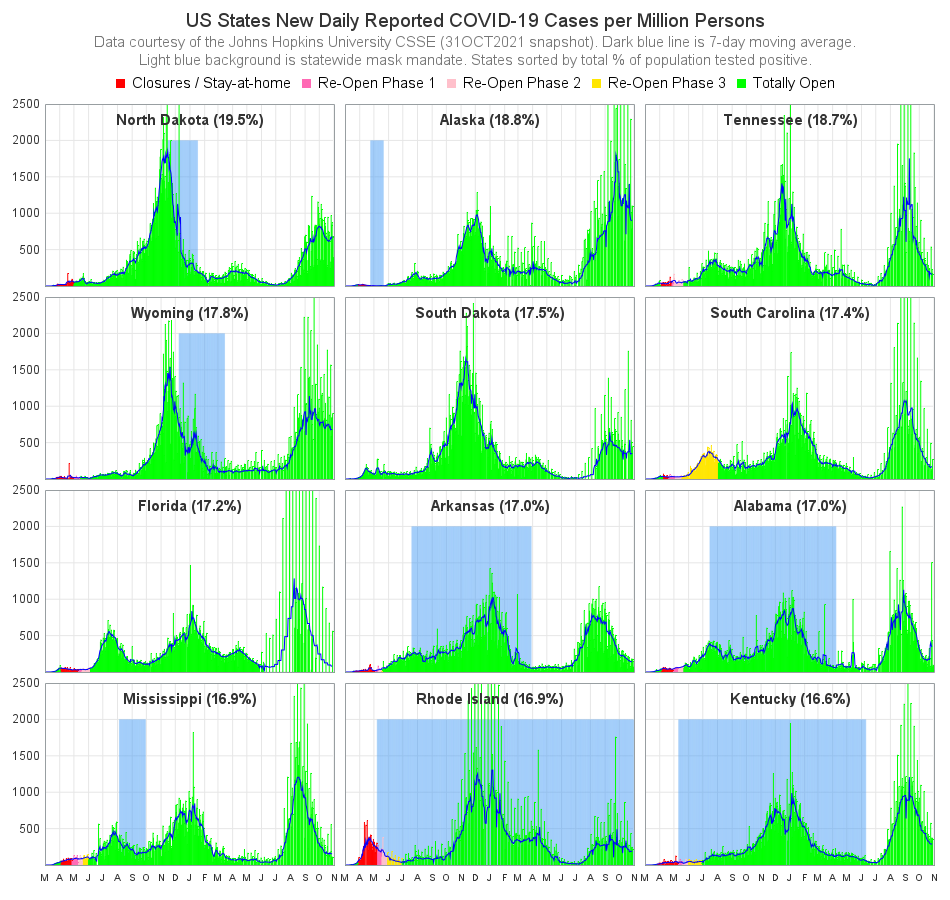
Cases Grid by State
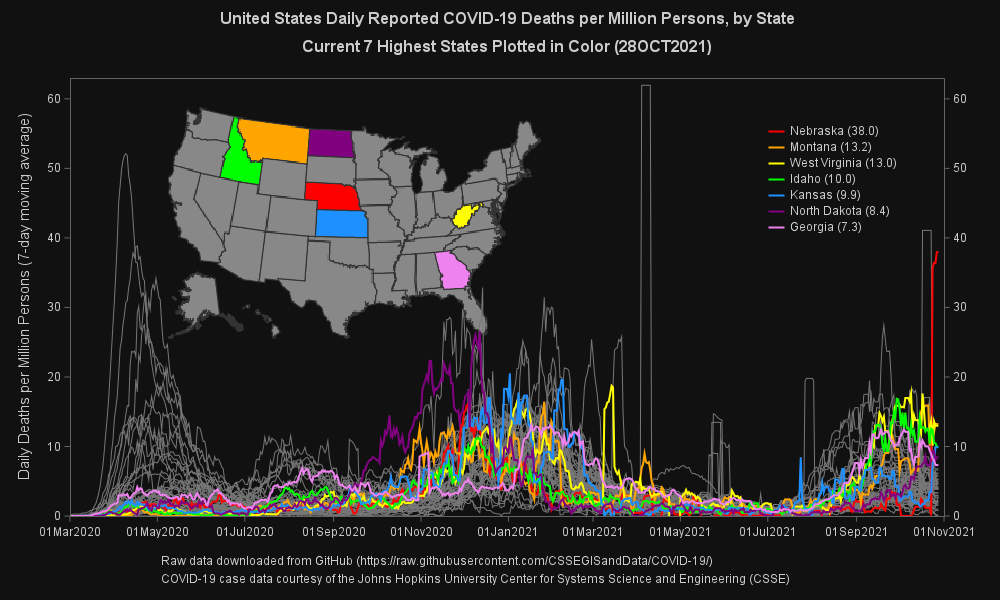
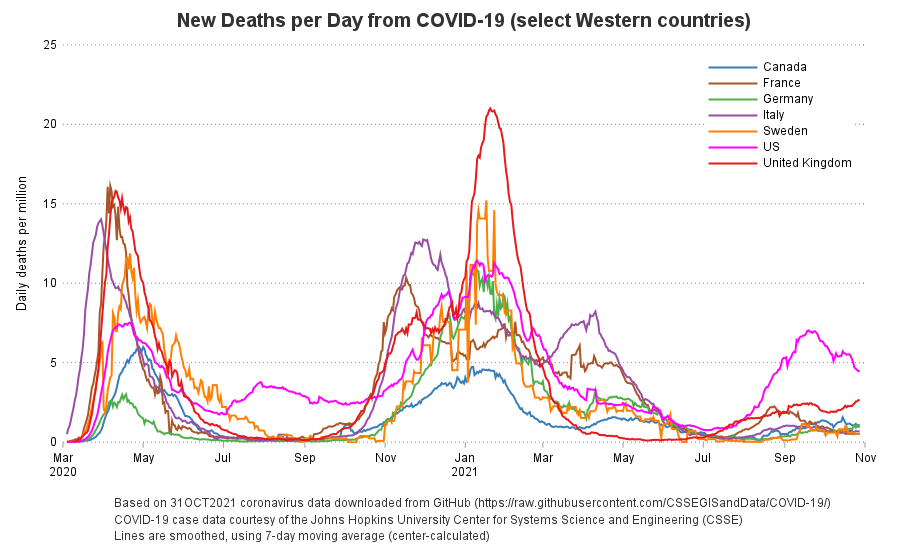
Deaths Spaghetti Plot
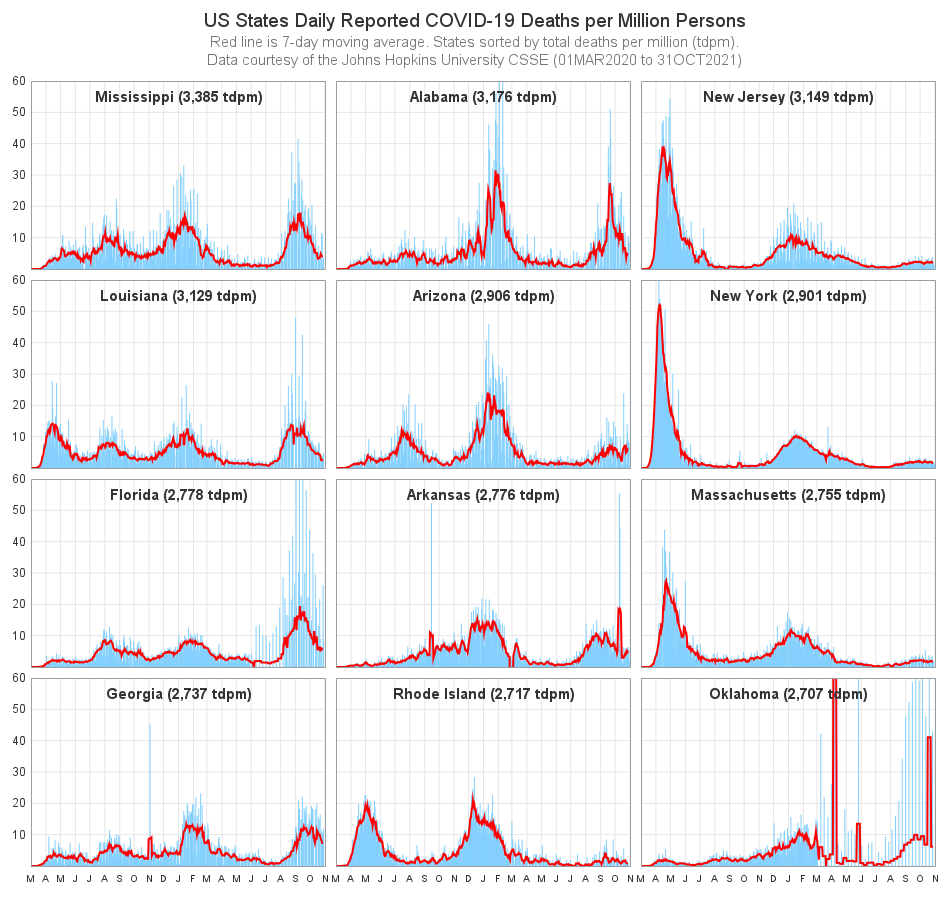
Deaths Grid by State
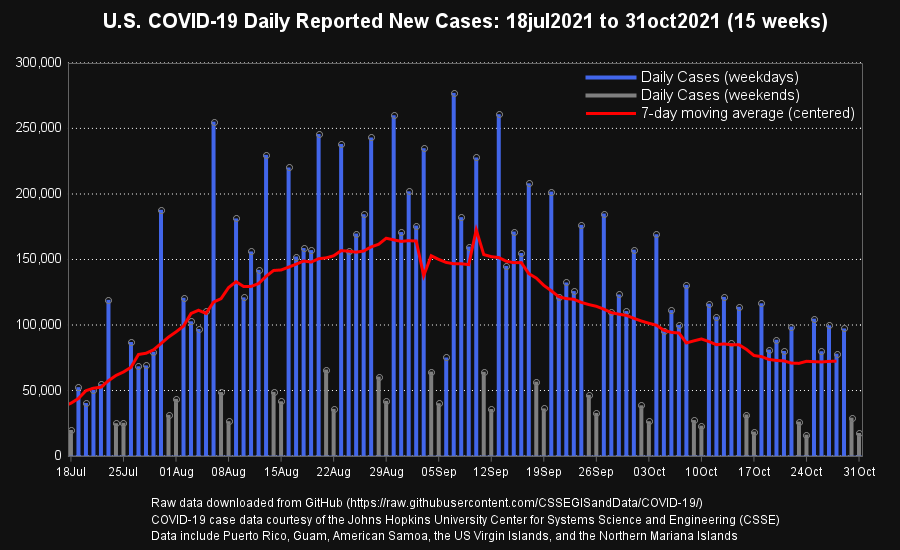
Cases Last 15 Weeks
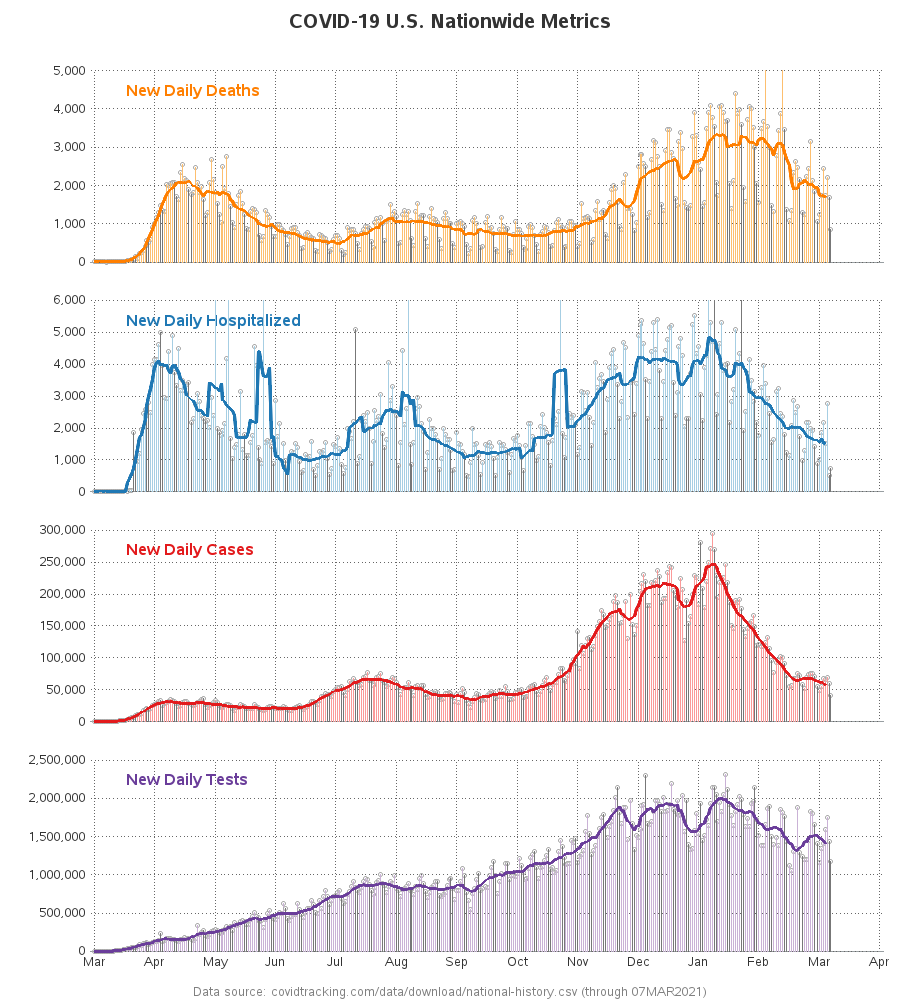
COVID Metrics Plot
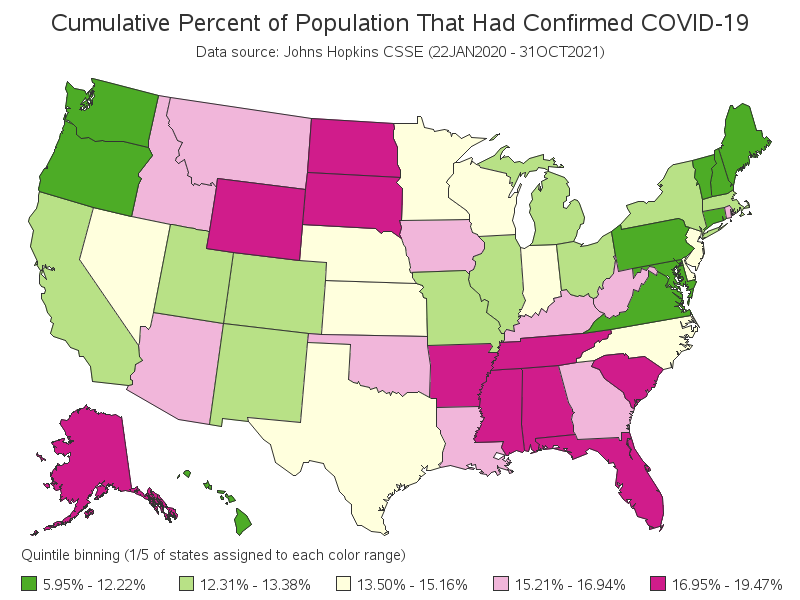
Cumulative Cases
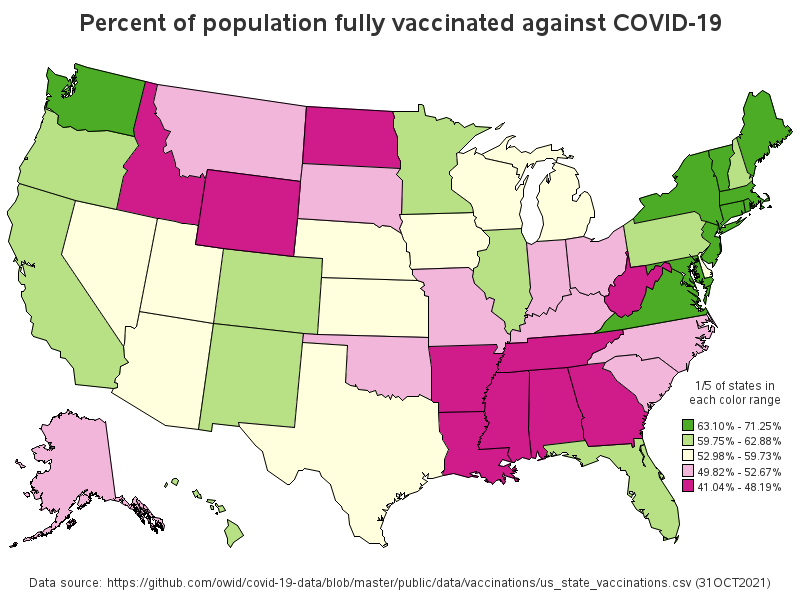
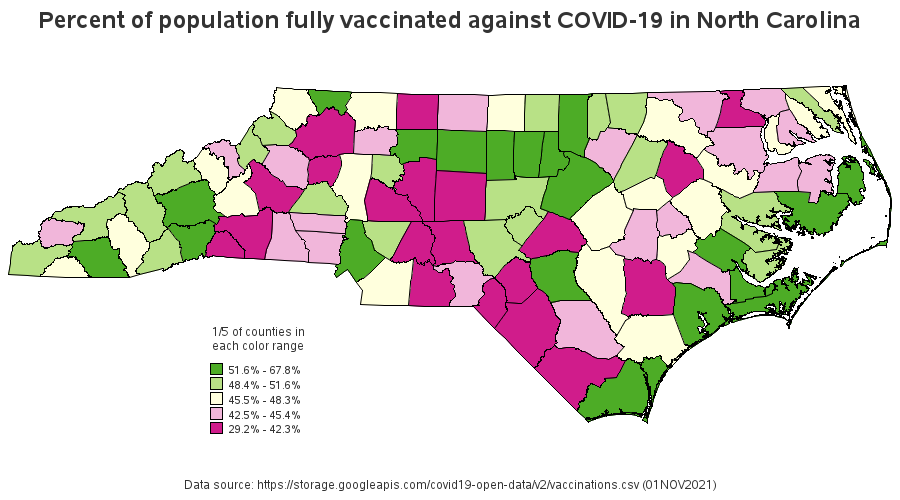
Percent Vaccinated
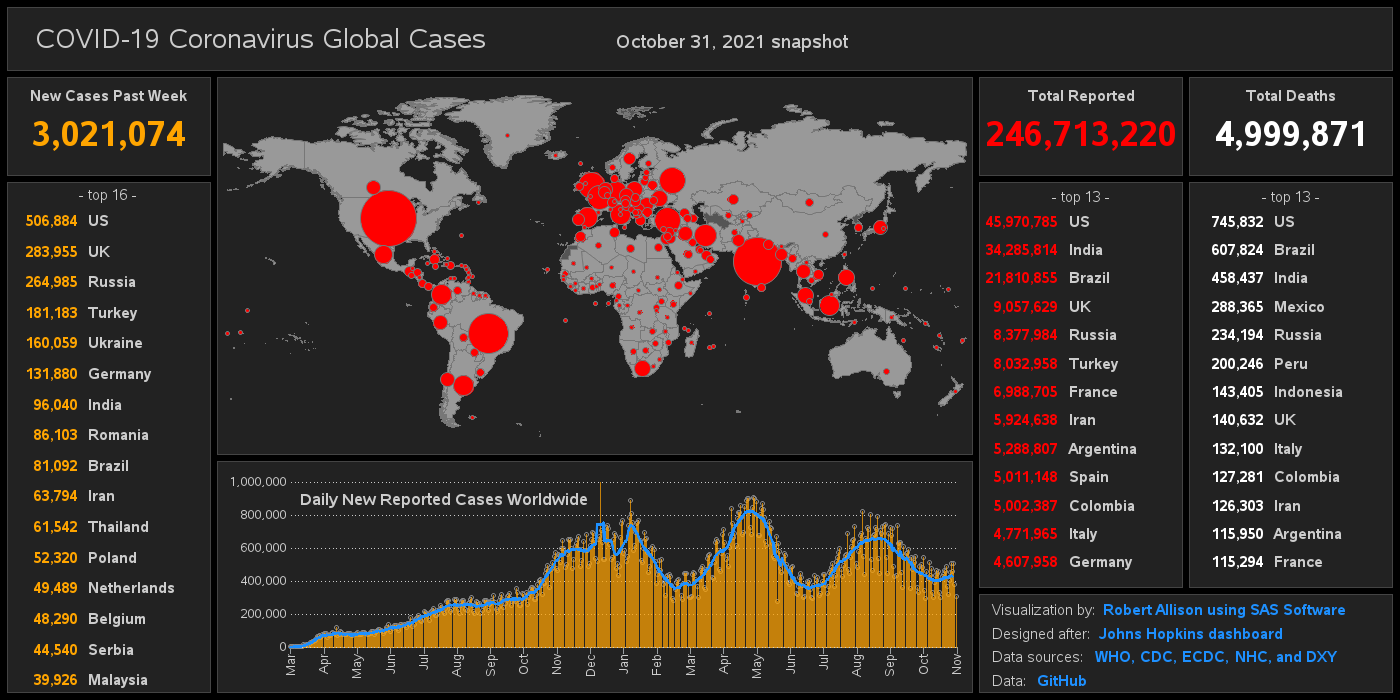
Countries Dashboard
Covid Deaths Country
Total Deaths Country
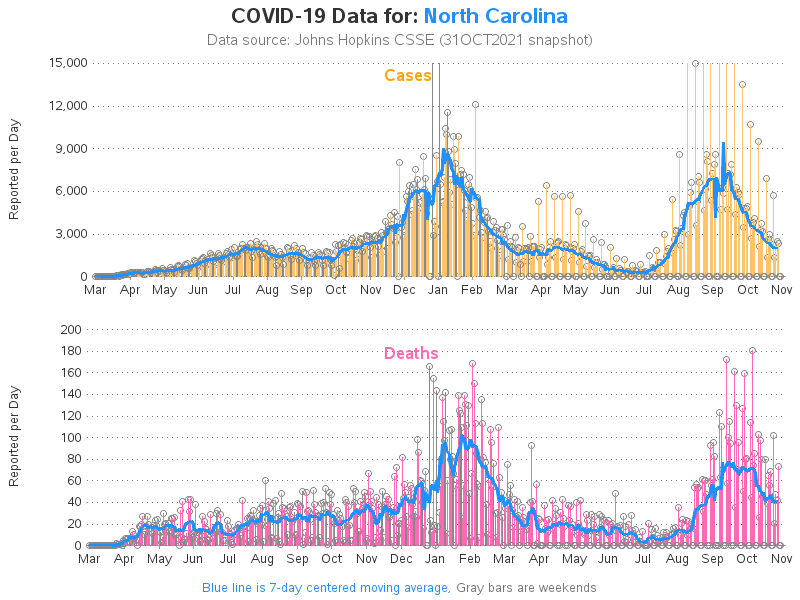
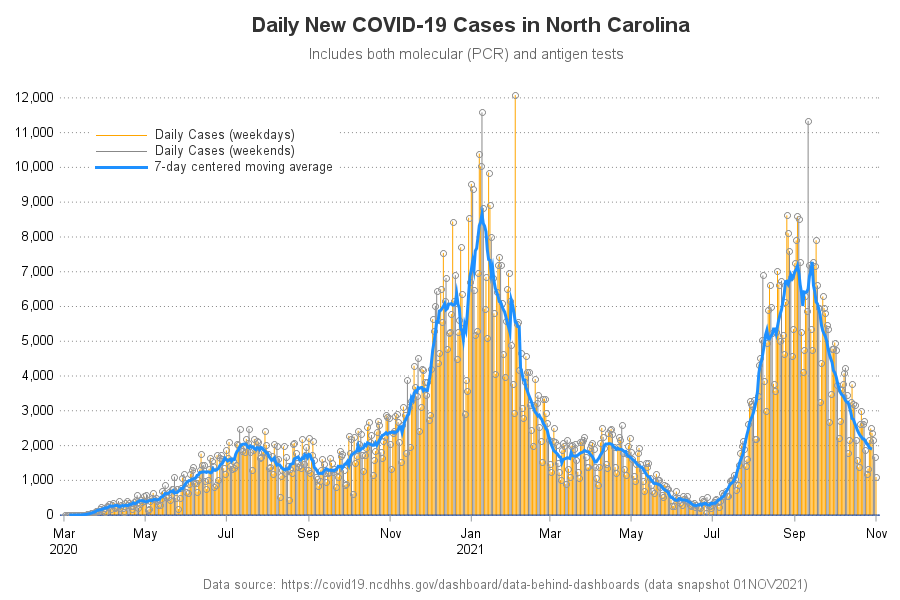
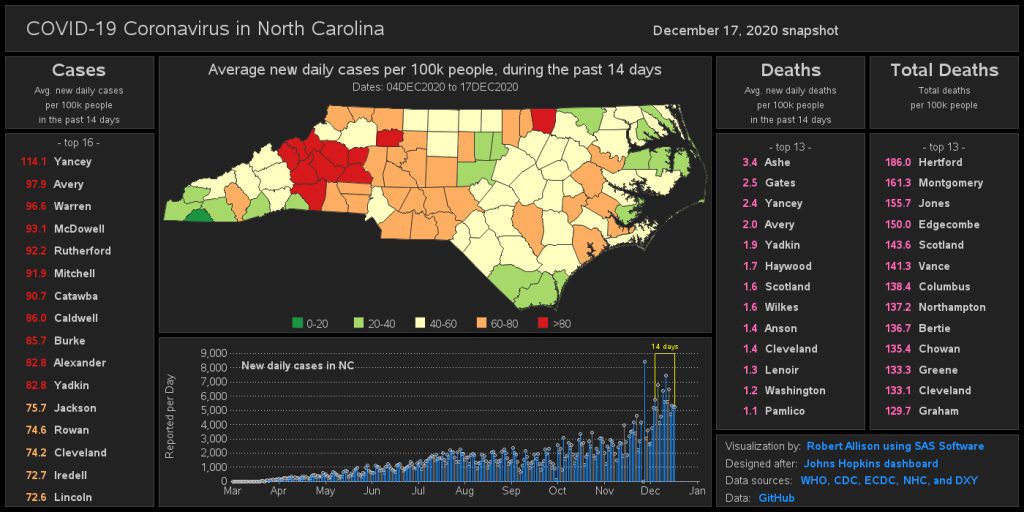
North Carolina Data
US State Animation
US County Animation
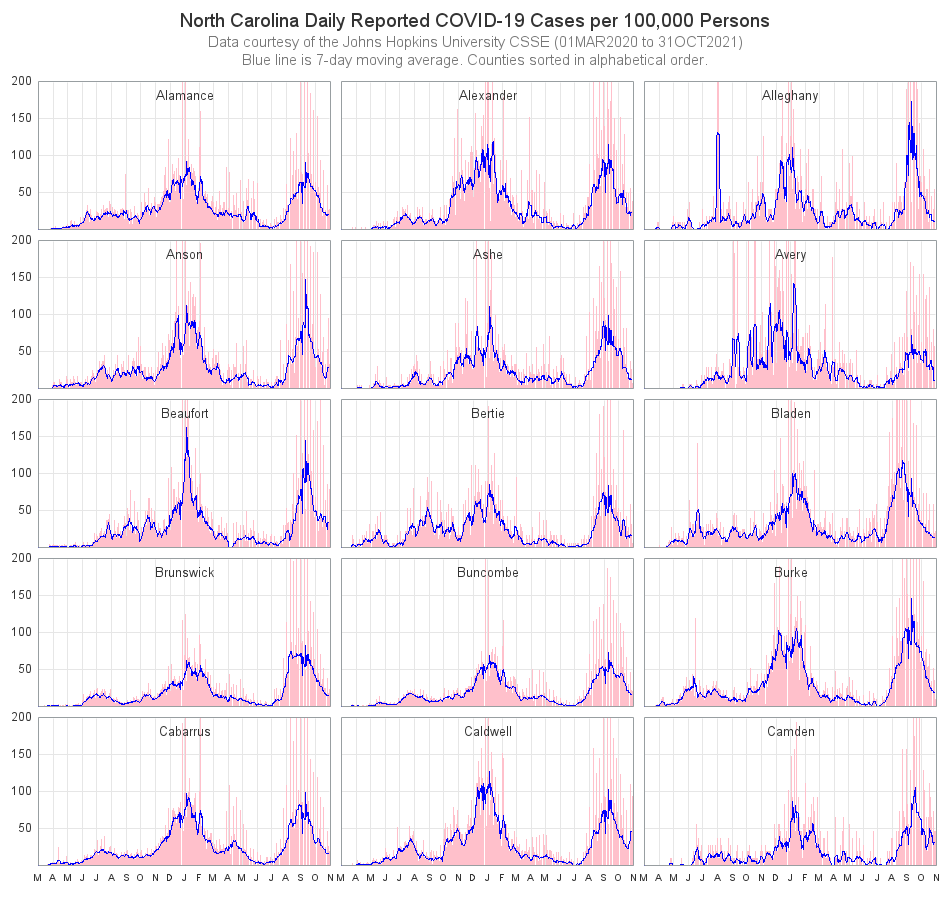
NC County Animation
Official NC Data
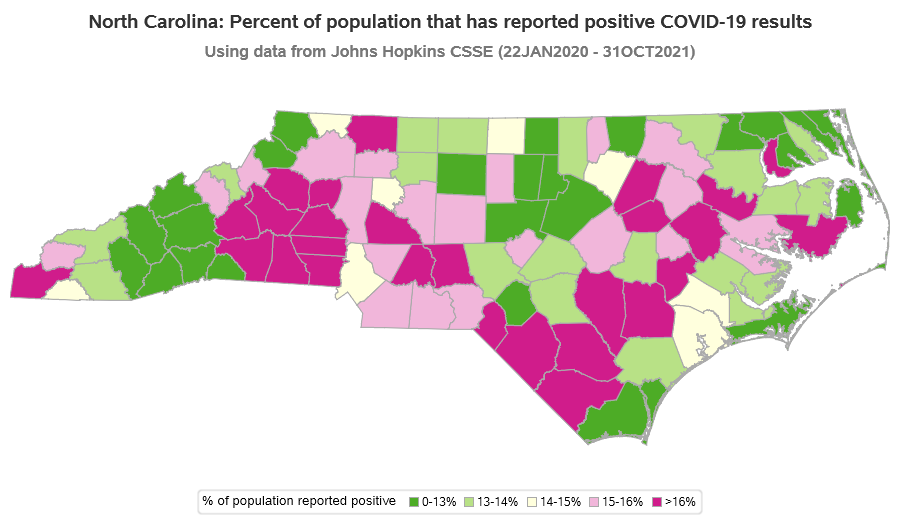
Covid Percent in NC
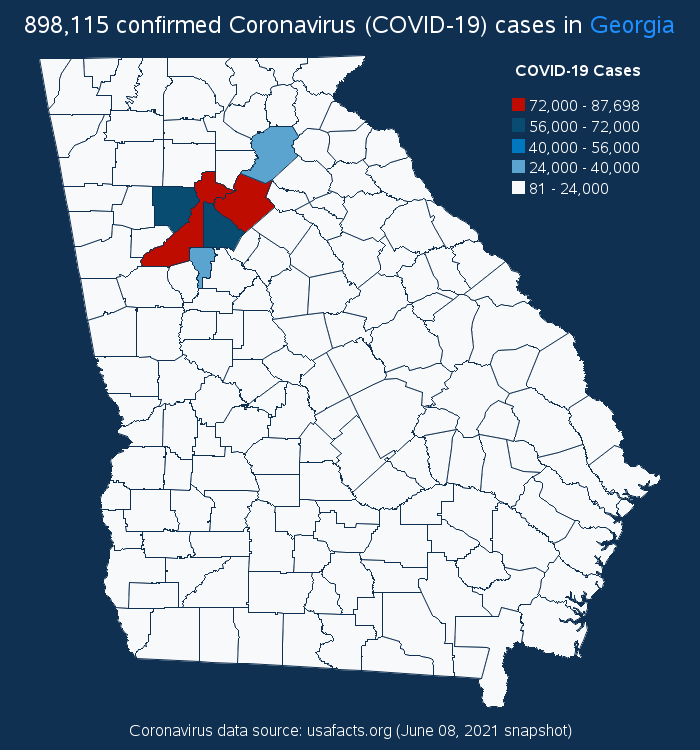
Coronavirus in GA
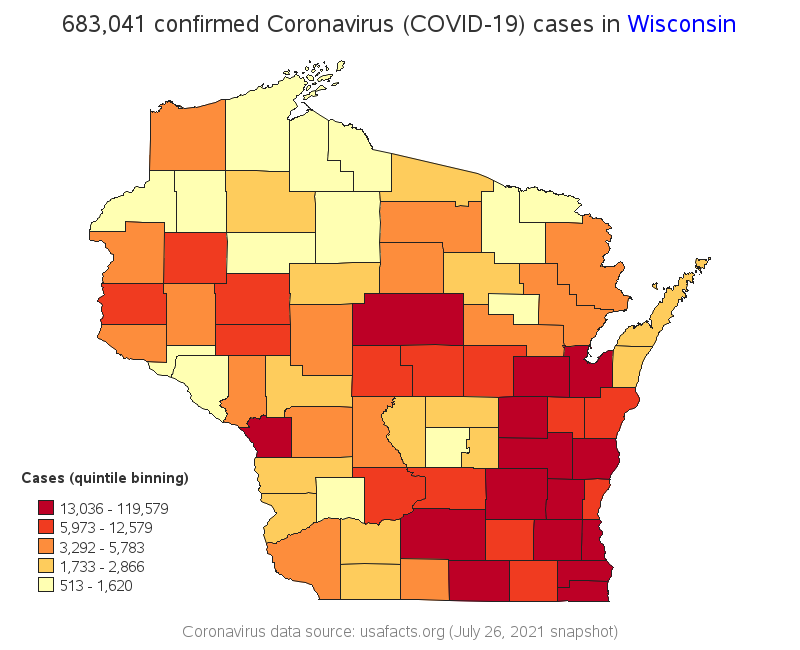
Coronavirus in WI
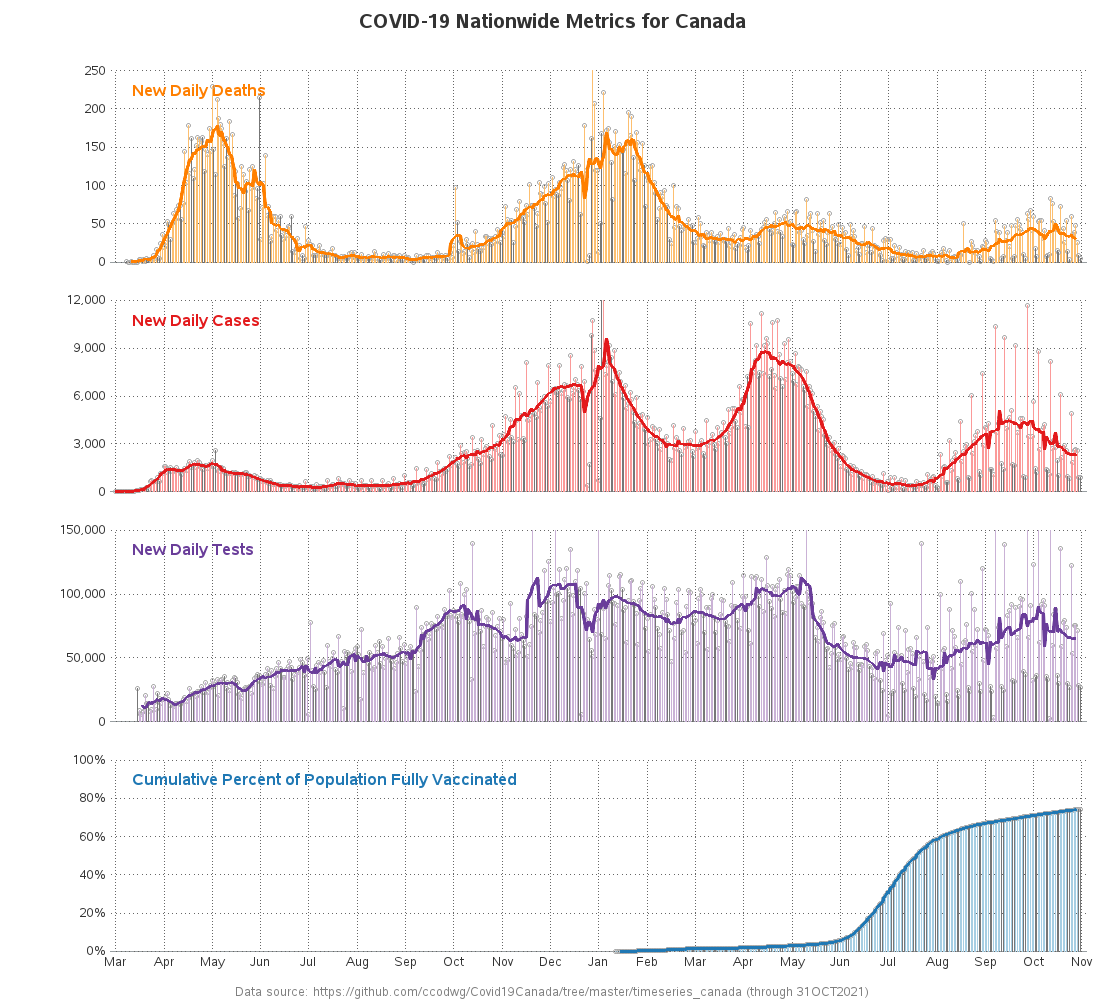
Canada Covid data
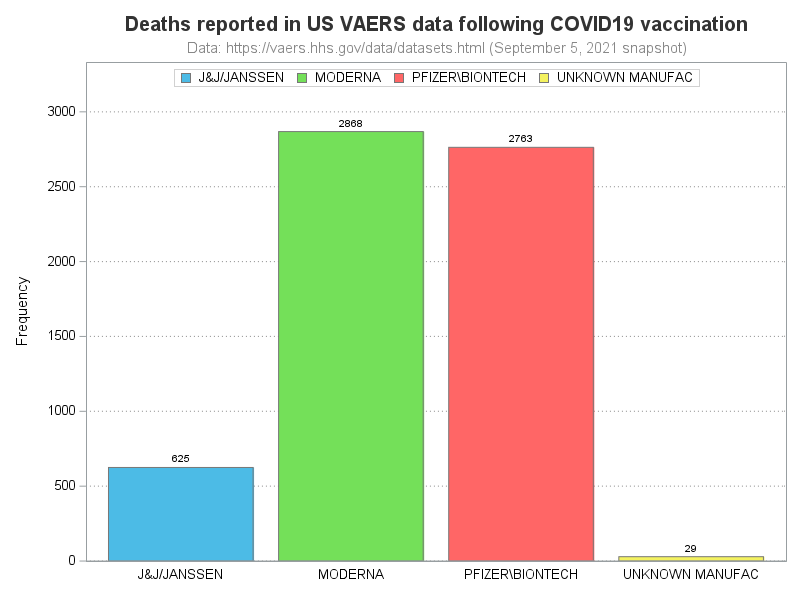
VAERS Covid Deaths
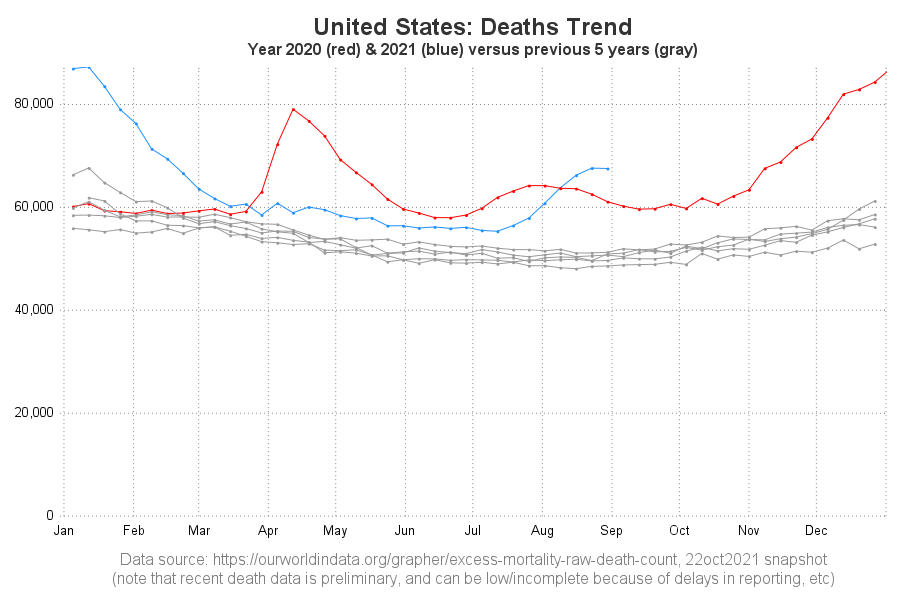
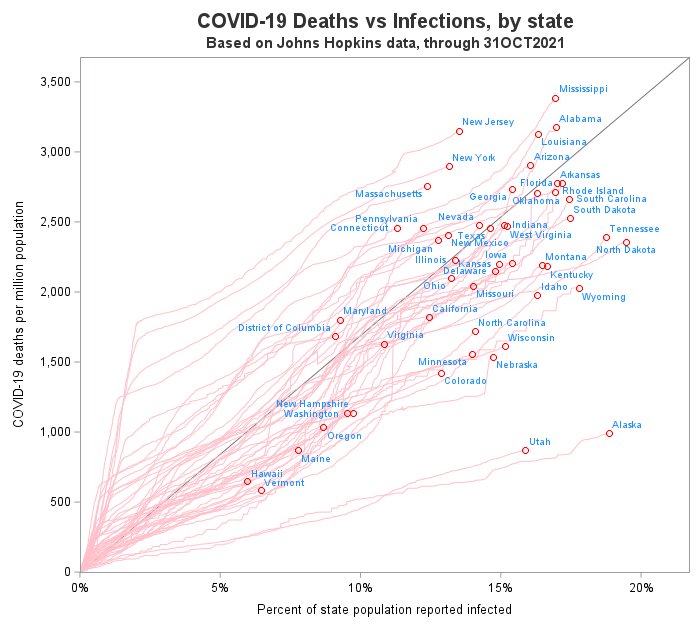
Deaths versus Cases
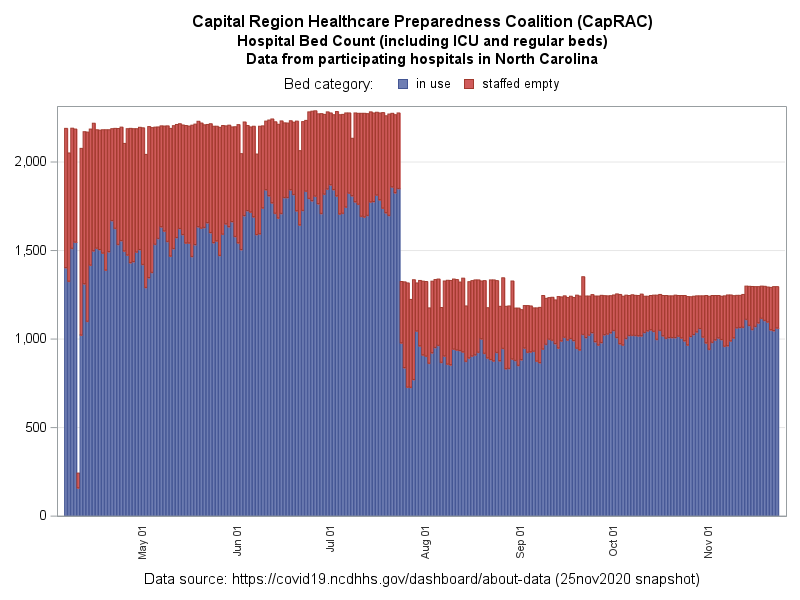
NC Hospital Beds
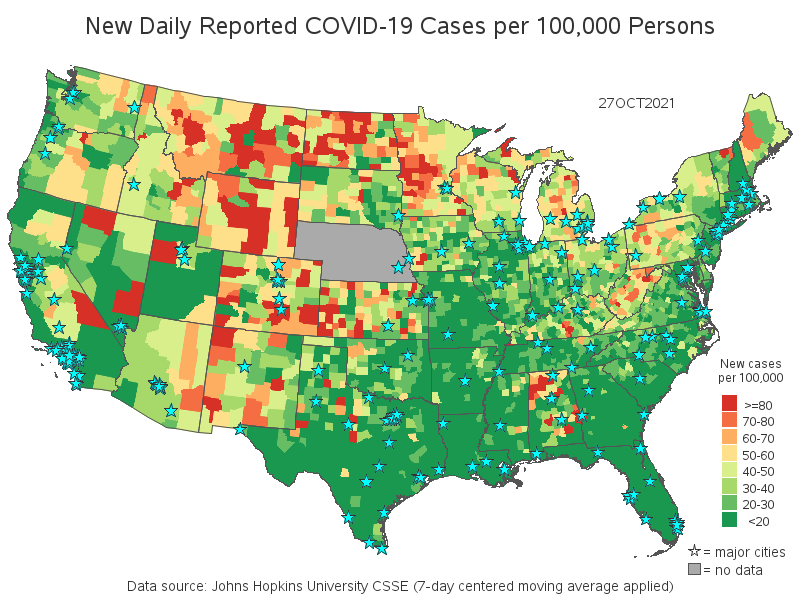
Covid Cases County
Intranet Example *
Intranet Example *
NC County Vaccine
NC County Plots
These samples courtesy of Robert Allison
Please see the following README