Sections 5.1 through 5.4 describe how the Textile and Apparel Business Information System (TABIS) user interface was built, and how it can be used. A combination of traditional and innovative computer programming techniques were used to provide a menu-based user interface with functionality, flexibility, and versatility far superior to any of the existing systems.
The interface gives novice users the functionality to easily generate tables, plots, and geographical maps of the data by selecting choices from simple menus. Novice users can easily select data from any single source, integrate data from multiple sources and/or years where applicable, create publication-quality plots and maps, and perform certain "canned" analyses with no programming knowledge. To accomplish this, meta data was encoded into the system to give it the "intelligence" to perform these functions automatically.
The system also provides advanced users with the flexibility to add their own extensions. For example, users can customize the SQL queries, and make modifications to the graphical output and analyses, or even write entirely new programs to run against the TABIS data warehouse. The system also allows advanced users to integrate their own data with the TABIS data, while protecting the TABIS data from accidental (or malicious) modification.
In addition to the high degree of functionality and flexibility, the TABIS user interface is versatile enough to allow access from several different computing environments, such as Unix workstations from various vendors, PCs, MacIntoshes, dial-in connections, remote logins, etc. (see Section 6.5). Portable programming methodology and networking technology were utilized to provide this versatility. By comparison, most of the existing PC-based systems only run on a PC, and can only be accessed directly from the PC on which it is installed.
The TABIS user interface possesses a combination of characteristics not found in any of the existing systems -- it is a code generator, it is architecture independent, and it is extensible. Also, based on interviews with developers at SAS Institute, the strategy used to implement the interface is unique. This section describes the coding methods used to implement the TABIS user interface.
The TABIS interface is implemented using over 100 C programs -- one for each data set and each type of report (such as tables, plots, and maps). These C programs use simple ASCII menus to prompt the users for the desired type of report, years, and categories of data, and then use code generating techniques to write and execute the SAS code needed to perform what the user has requested.
In response to the menu
prompts,
the user can enter a simple ASCII value, or simply
press "Return" to use the built-in
defaults.
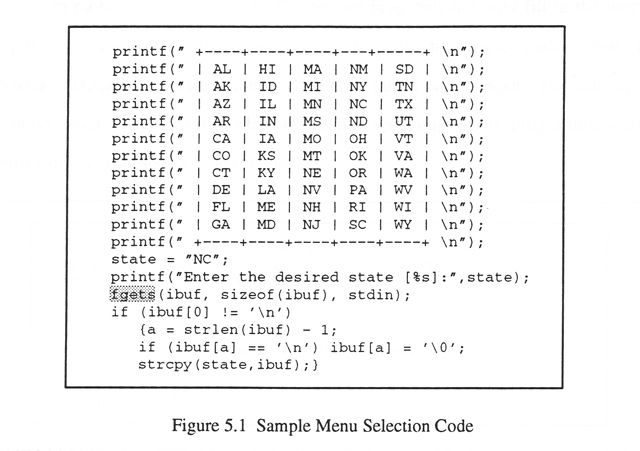
The fragment of code in
Figure 5.1
shows how the ASCII menu selections are displayed, and how the user's
input is read. The printf statements display messages and choices to the user,
and the fgets statement reads the user's input. If the input string is
non-null
(ie, ibuf[0] != '\n'), it replaces the default value, otherwise the default value
is used.
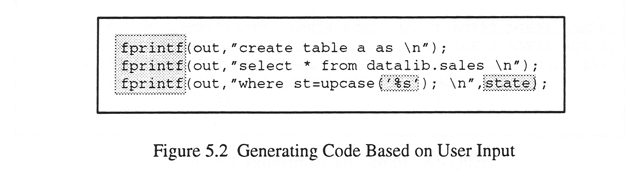
In the simplest case, the interface generates the SAS code needed to perform
the desired query, manipulate the data, and display the output appropriately, filling
in the user's input where needed. The SAS code is written to the "tabis.sas"
output file using the C fprintf command
(see Figure 5.2).
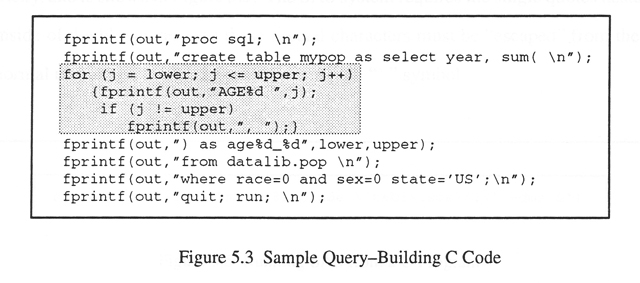
In more complex cases, the C interface programs not only fill in the users' input, but use conditionals and/or go through numerical code loops to programmatically generate dynamic SAS code based on the input. The following pseudo code shows how population age groups can be programmatically built using a "for" loop in the C code (see Figure 5.3).
In the previous example (Figure 5.3), if the user enters 15 for the lower age and 50 for the upper age, the following SAS code would be generated automatically (Figure 5.4), saving the user the error-prone and labor-intensive job of manually specifying each AGExx variable in a SAS/SQL query.
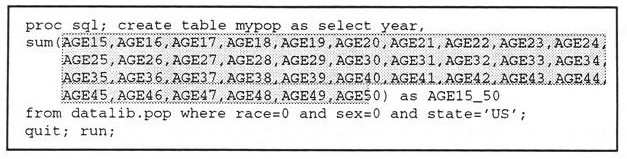
Figure 5.4 Programmatically-Built SAS Query
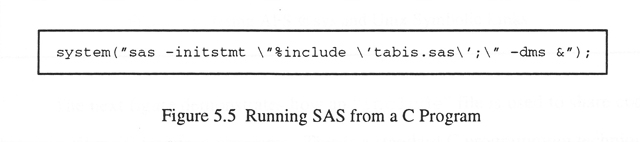
After programmatically building the "tabis.sas" file in the user's current directory, the interface asks the user if it should start a SAS session and execute the "tabis.sas" program automatically, or allow the user to run the SAS code manually (the latter option is useful if the user plans to modify the code, or add extensions). The C code used to submit the SAS program automatically is somewhat tricky, and is shown in Figure 5.5. The SAS system requires single quotes nested inside of double quotes, and the quotes must be "escaped" from their normal meaning in the C program by using the "\" (backslash) character.
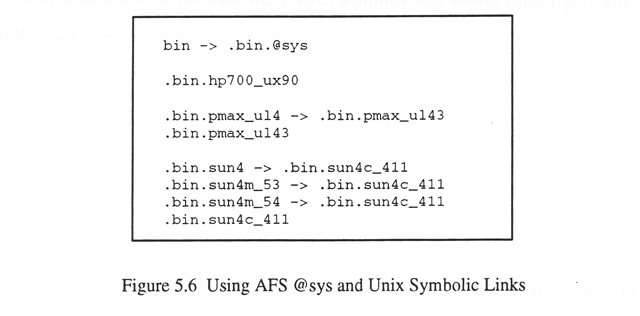
The TABIS interface is architecture-independent in 2 ways. First, since C and SAS can be run on almost any computer architecture, the interface programs themselves can be easily ported to run directly on other computers. Currently, TABIS has been ported to DEC, HP, and Sun Unix workstations. The multi-architecture versions co-exist, transparently to the users, through the use of Andrew's File System (AFS) links to the binary and data set directories (see Figure 5.6). [McD]
The tabis/bin/ directory, which always appears to contain the correct
compiled executable
version of the C interface programs no matter which flavor of Unix you are using,
is really a Unix
symbolic link
which "points" to the binary directory for the hardware/operating-system platform it is run
on. This is accomplished using the AFS @sys variable in combination with Unix symbolic links
such as "bin -> .bin.@sys"
Figure 5.6.
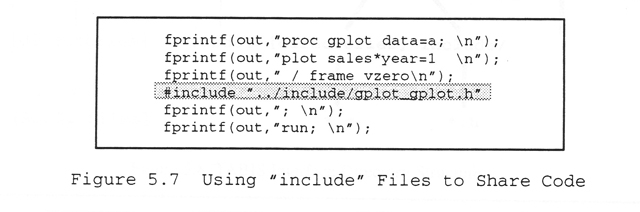
The next figure demonstrates how an include file is used to share code between all the C interface programs (by convention, these 'include' files end in '.h'). This is a C programming technique that allows changes to be made in one central location, and automatically propagate to all the other programs which "include" that shared file the next time the interface programs are compiled. The include file is referenced by a "relative path" name to make moving the code to a different directory much easier (Figure 5.7).
Unix Makefiles are used to automatically re-compile the programs when their C code is changed. For example, to change the interface program that maps the County Business Patterns (CBP) data, the TABIS administrator would simply perform the following three commands:
    cd /ncsu/tabis/src/cbp
    vi map_cbp.c
    make
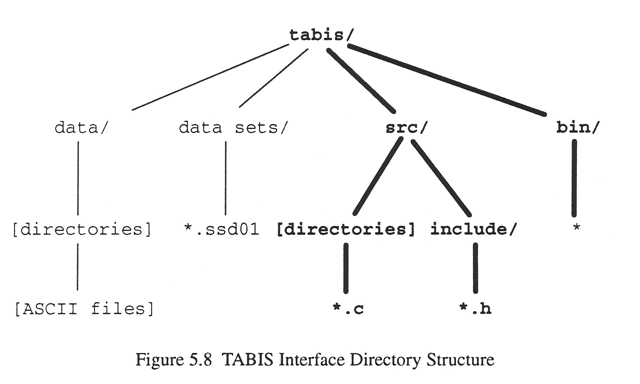
The C source code (.c and .h files) and compiled executables (binaries) are stored in a directory structure similar to those used for the ASCII data and SAS data sets (see Figure 5.8).
In addition to actually porting the code and data to other architectures, TABIS is architecture-independent in another way -- TABIS can be run on a supported architecture, and the results displayed on a computer of a non-supported architecture, either in ASCII or graphical format. The following two sections describe in more details the varying degree of functionality available using different methods to access TABIS.
The ASCII-based TABIS menu programs can be run from any computer architecture that can remotely access (eg, rlogin, telnet, dial-in, etc) a computer where TABIS is installed, since they were written using ASCII-only prompts and inputs. This functionality would not have been possible had a Graphical User Interface (GUI) been used.
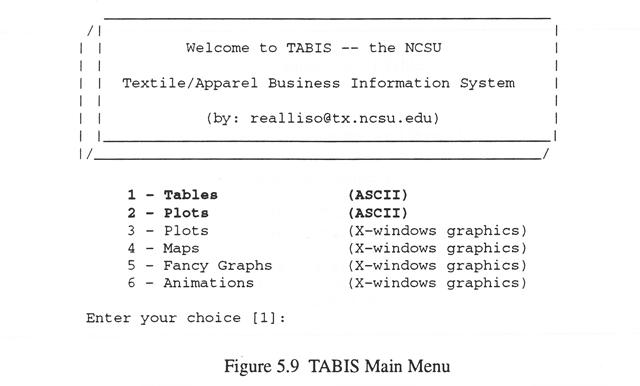
Similarly, ASCII output can be viewed by users from any computer architecture. Users can generate simple ASCII tables and plots containing subsets of any of the data in the TABIS data warehouse. The ASCII capabilities are available as menu options 1 and 2 from TABIS's main menu (Figure 5.9).
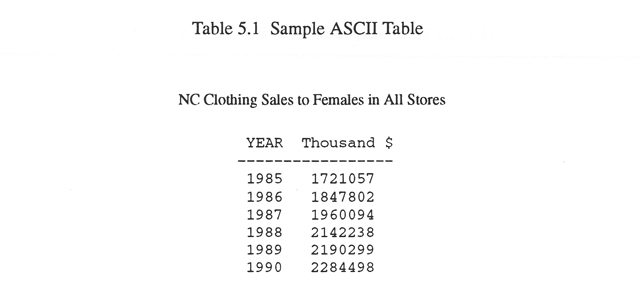
To create a table, the TABIS interface uses the built-in meta data, and then prompts the users to let them know what selections are available in TABIS. After asking a series of questions to determine the subset of data a user is interested in, the TABIS interface generates the SAS code needed to select that subset of data (using SQL), executes the code, stores the results in an ASCII file ("tabis.lst"), and displays the file to the user with the Unix "more" command.
ASCII tables, like the one shown in Table 5.1 (sample data from the Sales and Marketing Management Magazine (SMM) ), are very versatile. In addition to allowing the user to view a desired subset of data on the screen, the ASCII file can be easily transferred to another computer using methods such as the file transfer protocol (ftp), "kermit", or "Sneaker Net" (transferring the file on a floppy diskette, by walking it to another computer). Users can then analyze the data with their choice of hardware and software.
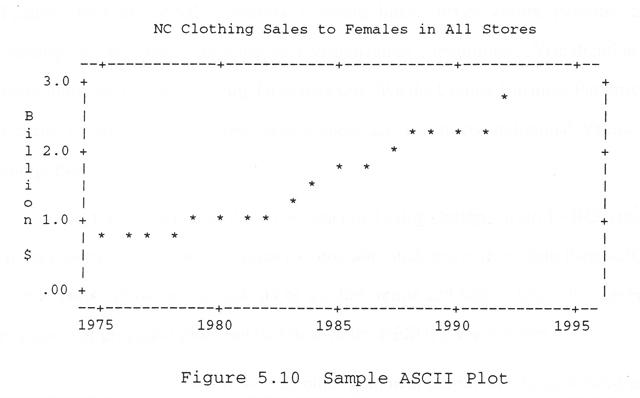
Simple plots can also be created using ASCII characters (aka "ASCII-art" plots). Figure 5.10 shows a sample of sales data plotted using ASCII characters. Although ASCII plots are not "publication quality", they provide a valuable data analysis tool in situations where higher-quality graphics are not possible, such as through simple character-only dial-in and telnet connections. Another advantage of ASCII plots is that they are quicker to calculate and view than graphical plots.
With high-resolution screens, printers, and other output devices available to most desktop computers, publication-quality graphics are possible for most users. Features such as special characters, symbols, lines, curves, colors, patterns, and shading can be used to provide data visualization capabilities. Visualization is particularly helpful in analyzing large data sets, like the County Business Patterns (CBP) or Census Population Projections, where there are too many individual values to comprehend.
Publication quality plots can be generated using Option 3 from TABIS's main menu (Figure 5.9). Graphical plots can contain much more detail than their ASCII counterparts, allowing the analysis of smaller trends and larger data sets. Several examples of high-resolution graphical plots can be found in the RESULTS in Section 6.
The graphical plots, as well as other graphical output, can be generated and viewed directly on any computer with X-Windows capabilities on the NCSU campus network that TABIS has been ported to (eg, DEC, HP, and Sun Unix workstations). Also any computer with X-Windows capabilities that can reach the NCSU computers via the Internet or other methods could allow the user to remotely login to the NCSU computers, run TABIS, and display the graphical results on their computer screen -- this is a feature of X-Windows.
Similarly, Option 4 from the main TABIS menu (Figure 5.9) allows users to create geographical maps if data is available by state or county. Data values are represented on the maps using different colors and patterns (called a choropleth map), or by plotting symbols on the map (such as dots or pie charts of different sizes). Because of the high resolution required, there is no ASCII counterpart to the maps.
The Option 5 (Figure 5.9) fancy graphs choice allows the users to run more complex "canned" analyze that are not included in the simple plots or maps options.
Option 6 (Figure 5.9) utilizes another graphics capability -- animations. The dynamic nature of data changing over time can be represented by displaying plots of the same data captured at intervals over a period of time. Animations are particularly useful in studying population shifts over time. Programs such as "xv", "xanim", and "mpeg_play" are used to "animate" the TABIS graphics. See Section 6.3 for examples of TABIS animations.
In addition to the ASCII menu-based TABIS interface, a new system is being tried that provides Internet users from around the world access to some of the TABIS graphical output. This new system, called the World Wide Web (WWW), is an information sharing system set up on the Internet to allow users from around the world quick, convenient access to textual and graphical information through Hypertext Markup Language (HTML) documents using a viewer like Mosaic. The WWW has viewers for X-Windows, MacIntosh, and Microsoft Windows computers, and is especially convenient since it does not require the users to have an account on the NCSU computers. Several TABIS examples of publication quality graphics can be viewed on the WWW using the following Universal Resource Locator (URL) location (see Section 6.5.5):
http://www.tx.ncsu.edu/html/labs/tabis/tabis.html
Note that the original URL (above) is no longer active, but a new website with similar examples is being created at the following location:
http://www.robslink.com/tabis/
TABIS contains nearly 100 interface programs that produce tables, plots, maps, and a variety of analyses automatically, and there are practically "endless" combinations of choices from the menus. But, there are many other analyses that researchers or businesses might want to try, which are not built into the menus. Fortunately, TABIS is not a "black box" system, and allows custom analyses to be performed.
A black box system takes a set of inputs and creates the outputs without letting the user know what processes were used to create those outputs, and without allowing the user to change the data or the processes used to create the outputs. Most of the existing systems use the black box strategy.
TABIS, on the other hand, is an extensible system. Each time TABIS is run, it creates a "tabis.sas" file in the user's current directory. The users can examine this file to see exactly what SAS commands were run to query, transform, analyze, and graphically present the data. The users can then customize the "tabis.sas" file to perform additional analyses, merge in their own data, change the titles and footnotes, etc.